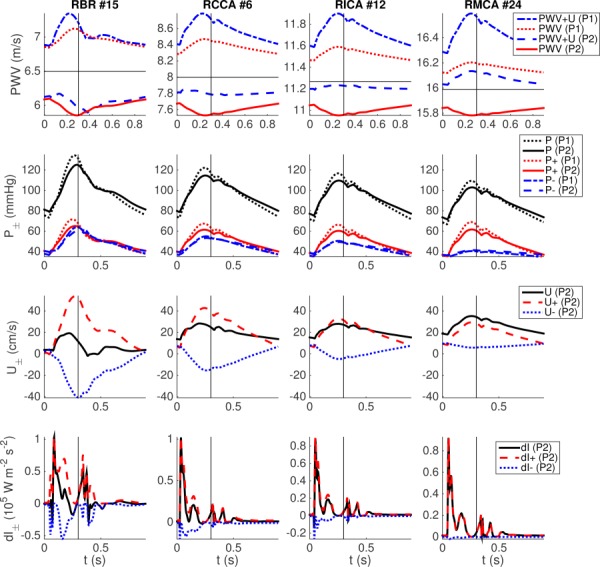
Fig. 2.

Waveforms in the RBR, RCCA, RICA, and RMCA. The first two rows compare waveforms resulting from the P1 and P2 pressure–area models, including (first row) PWV and total pulse-wave propagation speed (PWV + U), as well as (second row) full (P), forward (P+), and backward (P−) components of pressure. The third and fourth rows, respectively, plot the full, forward, and backward components for velocity and wave intensity. Horizontal lines denote the reference PWV . Vertical lines denote aortic-valve closure.
