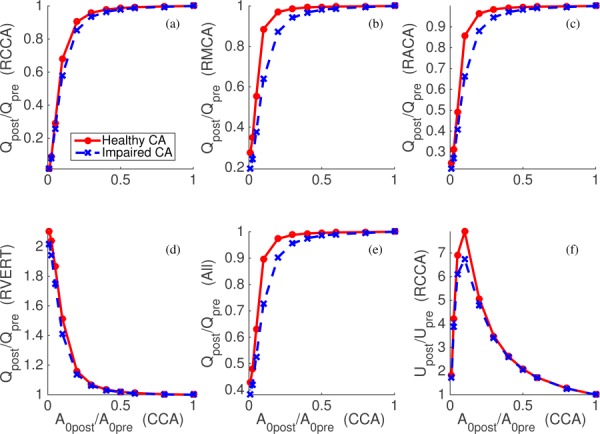
Fig. 4.

The changes of flow rates at the RCCA (a), RMCA (b), RACA (c), RVERT (d), all cerebral outlets (e), and velocity at the narrowed RCCA (f) due to the compression of both CCAs. Horizontal axes denote the baseline area of the narrowed portion of the RCCA compared to the initial baseline area. Solid and dashed lines represent the cases with healthy and unhealthy autoregulation cases, respectively.
