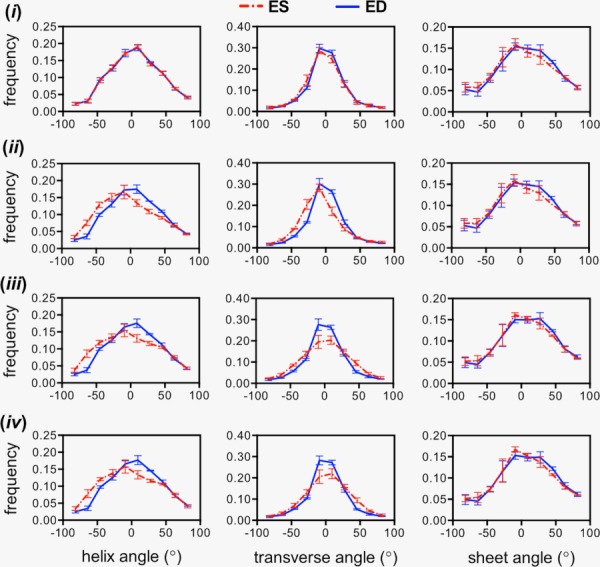
Fig. 6.

Averaged histograms of structural angle populations (n = 3) using the rotation-only approach to transform DTI data from an initial time point to ED and ES. The deformation results from case (i) (top row) do not show any difference between states, i.e., overlapping lines, constituting a poor prediction with respect to the experimental observations in Fig. 5. Cases (ii)–(iv) (rows 2–4, left column) produced similar helix angle distribution alterations that suggest longitudinal alignment at ES. Transverse angle alterations (middle column) are more realistic in cases (iii) and (iv). The rotation-only approach produced no visible differences in sheet angle distributions (right column).
