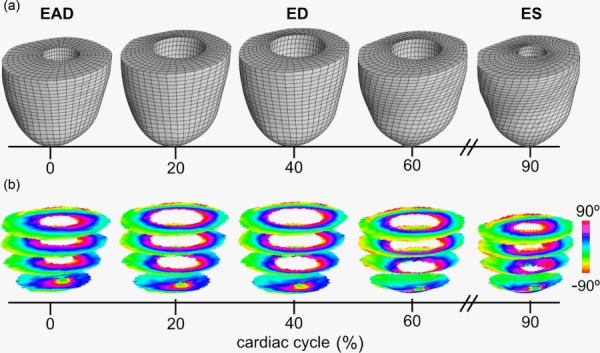
Fig. 8.

Warping DTI data across the cardiac cycle. The FE model (a) was used to generate deformation estimates at times beyond the validation points (ED and ES) using simulation approach (iii). The modeling approach follows a realistic temporal representation of pressure, volume, and contractility via FE modeling by using an image-based, subject-specific transversely isotropic material model. The warped image slices showing helical angle maps (b) show contraction-induced shortening and some angle variation indicative of longitudinal alignment.
