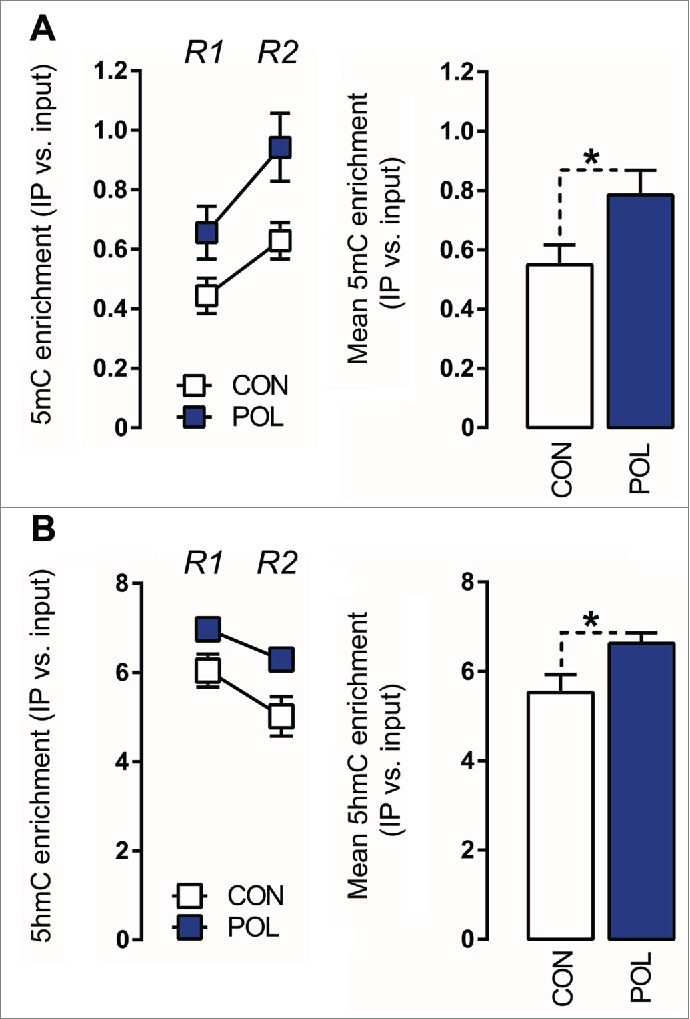
Figure 3.

Prenatal immune activation increases 5-methylcytosine (5mC) and 5-hydroxymethylcytosine (5hmC) binding at the GAD1 promoter region in the medial prefrontal cortex (mPFC) (A) 5mC binding was assessed by comparing the ratio of 5mC to the total cytosines in genomic DNA samples of control (CON) and poly(I:C) (POL) offspring. Left: The line plot shows 5mC ratios at both promoter regions of interest (Region 1, R1; Region 2, R2) for the CON and POL offspring. Right: The bar plot shows the mean 5mC ratios for both regions R1 and R2. *P < 0.05 as determined by a main effect of treatment arising in the repeated-measures ANOVA analysis over the two regions R1 and R2 of interest. (B) 5hmC binding was assessed by comparing the ratio of 5hmC to the total cytosines in genomic DNA samples of CON and POL offspring. Left: The line plot shows 5hmC ratios at both promoter regions of interest R1 and R2. Right: The bar plot shows the mean 5hmC ratios for R1 and R2. *P < 0.05 as determined by a main effect of treatment arising in the repeated-measures ANOVA analysis over the two regions R1 and R2 of interest. N(CON) = 8, N(POL) = 8. All values are means ± SEM.
