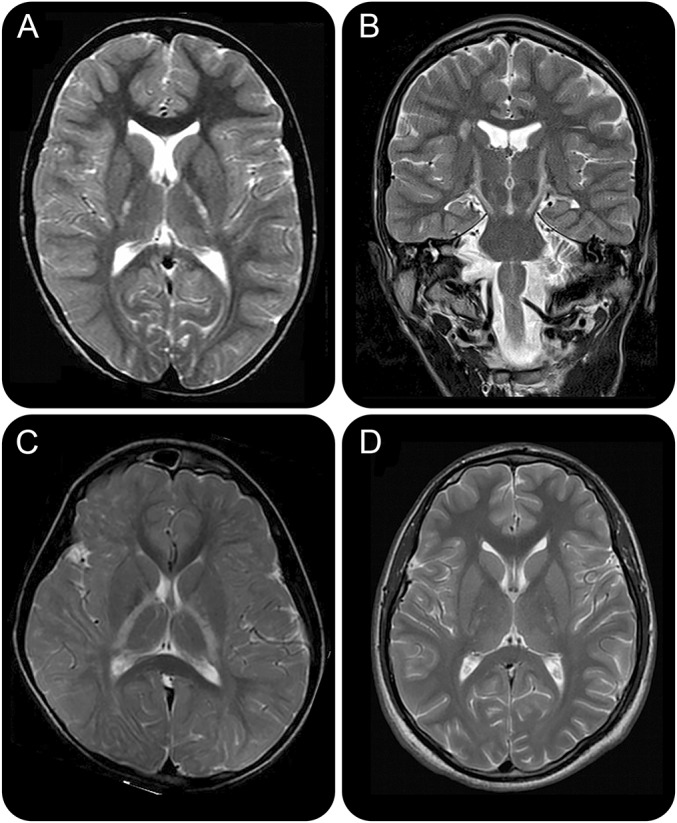
Figure 1. Involvement of the corticospinal tracts.

Axial (A, C, D) and coronal (B) T2-weighted images in patients 1 (A, B), 1 (C), and 8 (D) with POLR3A mutations show the presence of bilateral and symmetric T2-hyperintense signal at the level of the posterior limb of the internal capsules. Incomplete hypomyelination is seen in (B).
