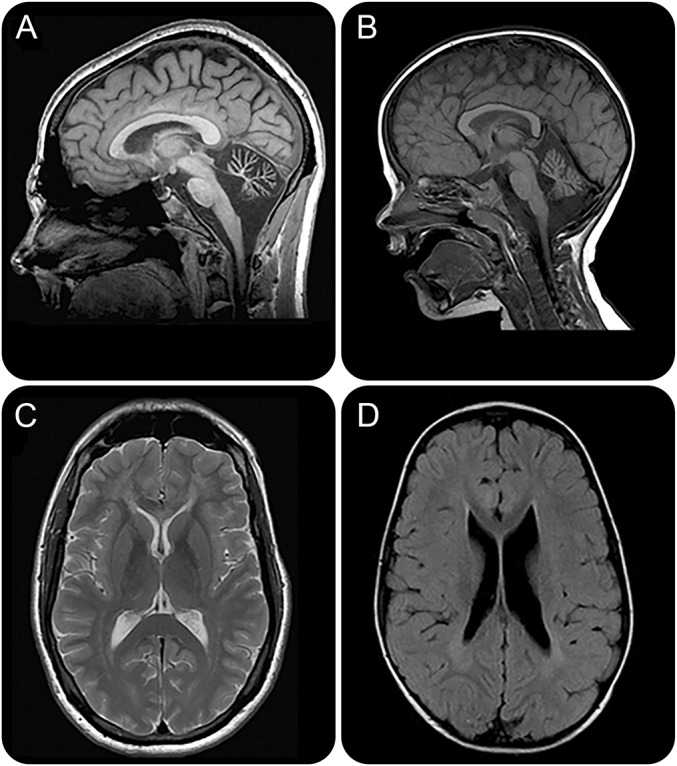
Figure 2. Cerebellar atrophy.

(A, B) Sagittal T1-weighted images from participant 4 with POLR3B (A) and participant 5 with POLR3A (B) mutations show the presence of severe (A) and moderate cerebellar atrophy. (C, D) Axial T2-weighted and T2–fluid-attenuated inversion recovery images of the patients presented respectively in (A, B) show the presence of partial hypomyelination.
