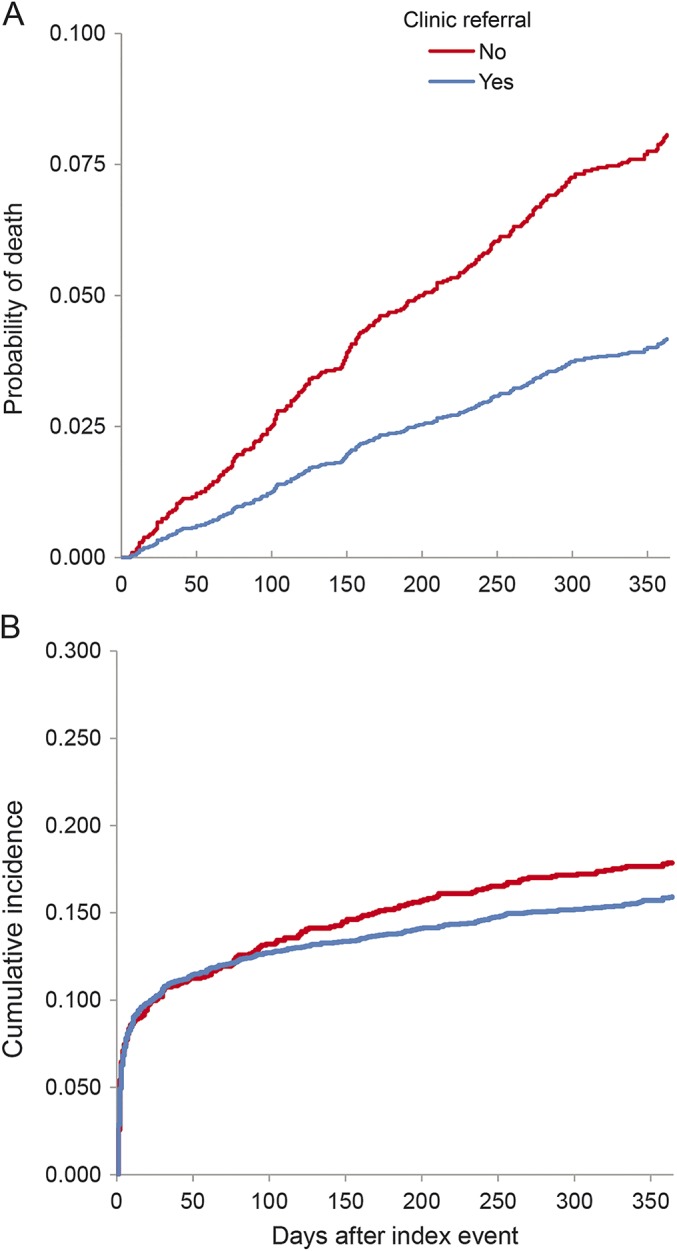
Figure 2. Adjusted probability of death and cumulative incidence of stroke/TIA in patients referred and not referred to stroke prevention clinics.

(A) Adjusted probability of death in patients referred and not referred to stroke prevention clinics. Adjusted for index event type (TIA vs minor stroke), age, sex, area of residence, disability before event, diabetes, hypertension, hyperlipidemia, dementia, smoking, atrial fibrillation, coronary artery disease, prior stroke/TIA, presenting symptoms (weakness, speech deficit, duration of symptoms, blood pressure), and hospital characteristics (stroke center, teaching status, size). The p value is <0.001 for the difference between patients referred and not referred to stroke prevention clinics, based on Cox proportional hazards model. (B) Cumulative incidence of stroke/TIA in patients referred vs not referred to a stroke prevention clinic. Adjusted probability of death in patients referred and not referred to stroke prevention clinics. Adjusted for index event type (TIA vs minor stroke), age, sex, area of residence, disability before event, diabetes, hypertension, hyperlipidemia, dementia, smoking, atrial fibrillation, coronary artery disease, prior stroke/TIA, presenting symptoms (weakness, speech deficit, duration of symptoms, blood pressure), and hospital characteristics (stroke center, teaching status, size). For difference between patients referred and not referred to stroke prevention clinics, p < 0.001, based on Cox proportional hazards model.
