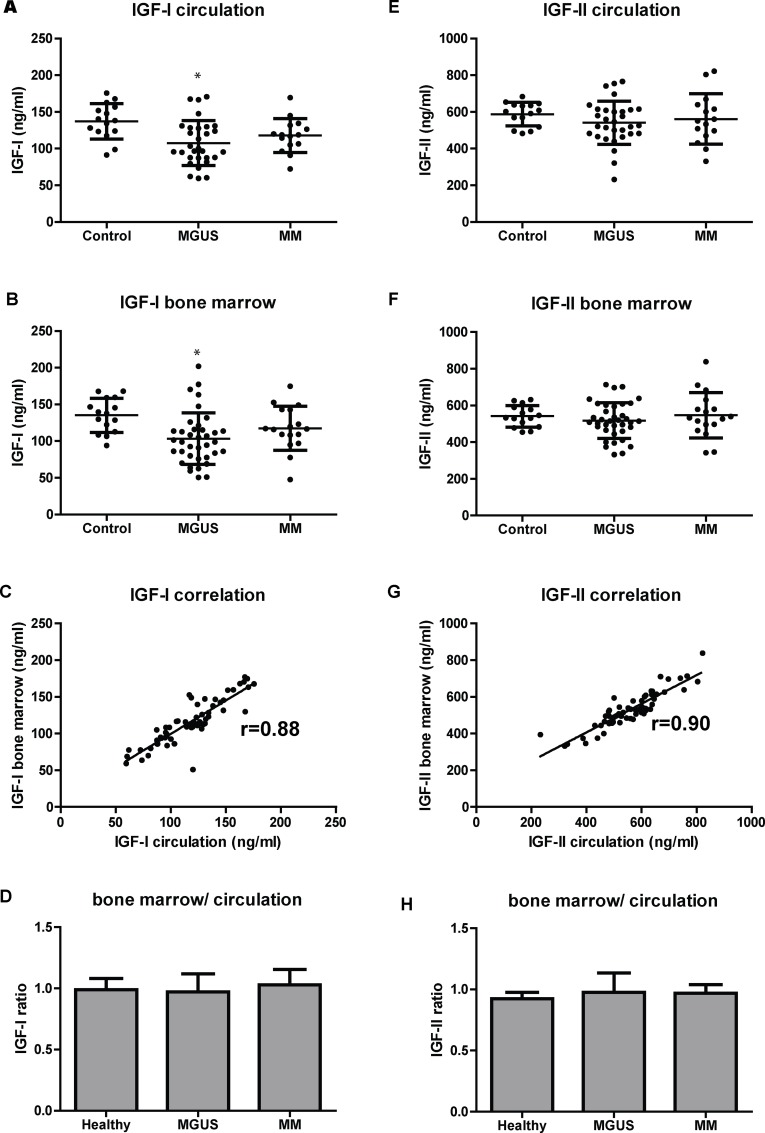
Fig 1. Total IGF1 and IGF2 levels in controls and patients with MGUS or MM.
Levels of IGF1 measured by ELISA (A, B) and IGF2 (E, F) in plasma from circulation (A, E) and bone marrow (B, F). Correlation analysis of IGF1 (C) and IGF2 (G) between bone marrow and circulation. Mean pairwise ratio of bone marrow to circulating (for each individual) IGF1 (D) and IGF2 (H). Dots represent individual patients. Bars indicate standard deviations. (r) Pearson´s correlation coefficient. * p<0.01 compared to control.

