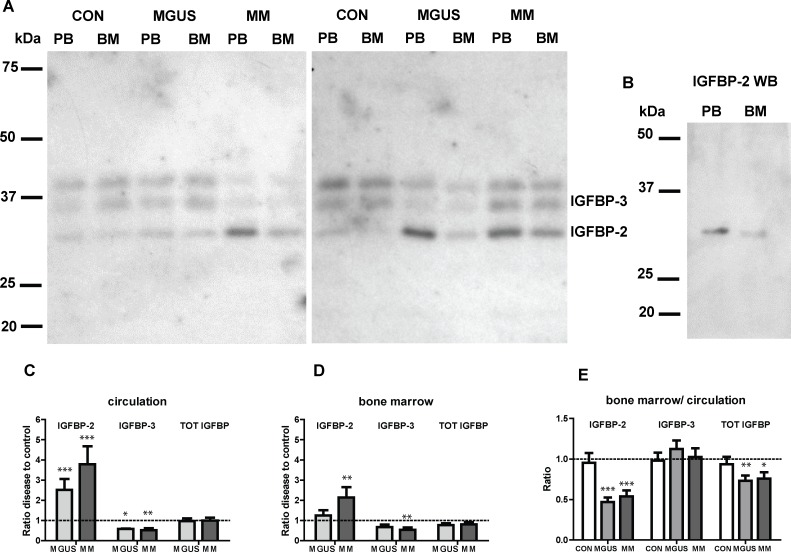
Fig 2. IGFBP levels and distribution in controls, MGUS and MM.
A) Autoradiograph of two representative 125I-IGF Western ligand blots displaying plasma samples from the circulation (PB) and bone marrow (BM) taken from MGUS and MM patients and control (CON) individuals. The two top bands appearing at 38 and 42 kDa represent IGFBP-3. B) Western immunoblot analysis using a monoclonal IGFBP-2 primary antibody, confirming the identity of the 32-kDa band as IGFBP-2. C) The IGFBP disease to control ratio in the circulation. D) The IGFBP disease to control ratio in the bone marrow. E) Tissue distribution of the IGFBPs shown as the circulation to bone marrow ratio. * p<0.05, ** p<0.01, *** p<0.001

