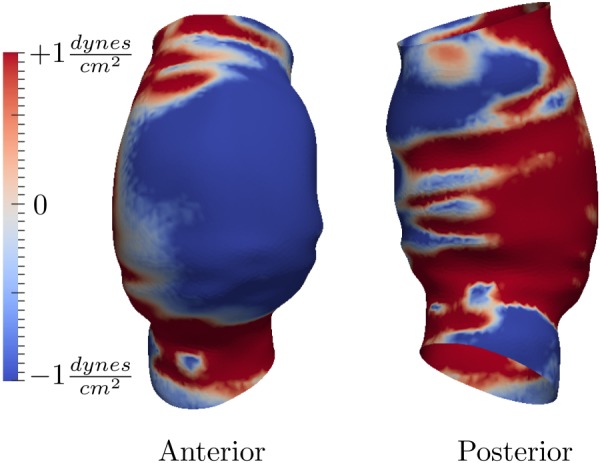
Fig. 6.

Sum of WSS vectors in the tangent direction () for a representative case (patient 4). Positive values show regions with dominant forward near wall flow. Negative values show regions with dominant backward near wall flow. The colorbar range does not represent peak values.
