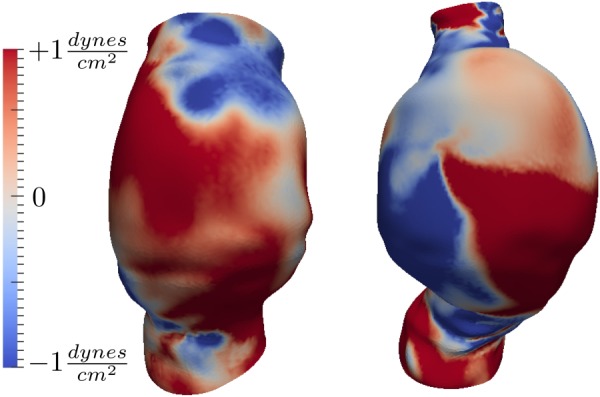
Fig. 7.

Sum of WSS vectors in the binormal direction () for two representative cases (patients 4 and 6). Anterior views are shown. Positive values show regions with dominant counterclockwise near wall rotating flow. Negative values show regions with dominant clockwise near wall rotating flow. The colorbar range does not represent peak values.
