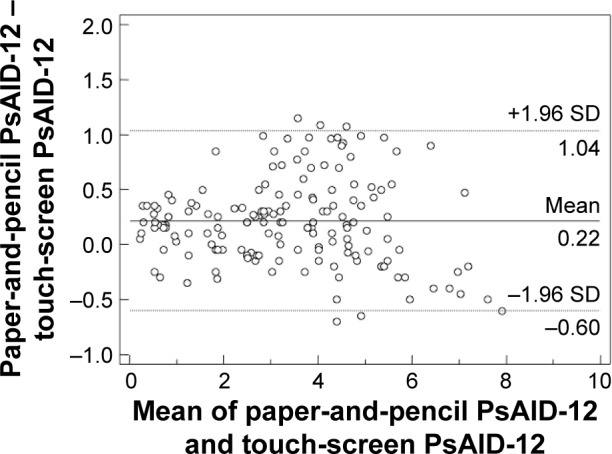
Figure 2.

Agreement between scores obtained by the touch-screen and paper versions illustrated by Bland–Altman plots for PsAID-12 (1.96 SD limits of agreement, −0.60 to 1.04; mean difference, 0.22).
Notes: The graphs display differences between formats using the paper format as the gold standard for each individual. Horizontal line gives mean difference between formats. Ninety-six percent of the differences against the mean values were less than two SDs (dotted lines).
Abbreviations: PsAID-12, Psoriatic Arthritis Impact of Disease 12 items; SD, standard deviation.
