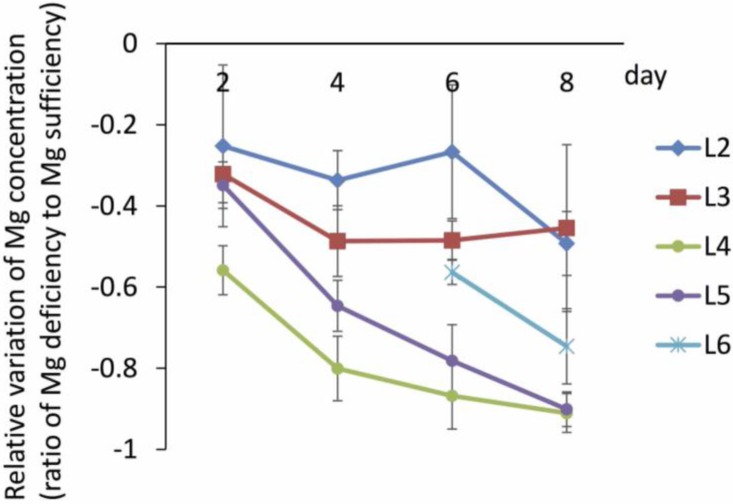
Figure 2.
Time course of relative variation of magnesium (Mg) concentrations, modified from the data of Kobayashi et al. (2013) [16]. Values are shown as Mg concentrations in Mg-deficient leaves relative to control leaves. The seedlings of rice were grown hydroponically for two weeks and then transferred to a culture solution without Mg. The leaf positions are defined in Figure 1c.

