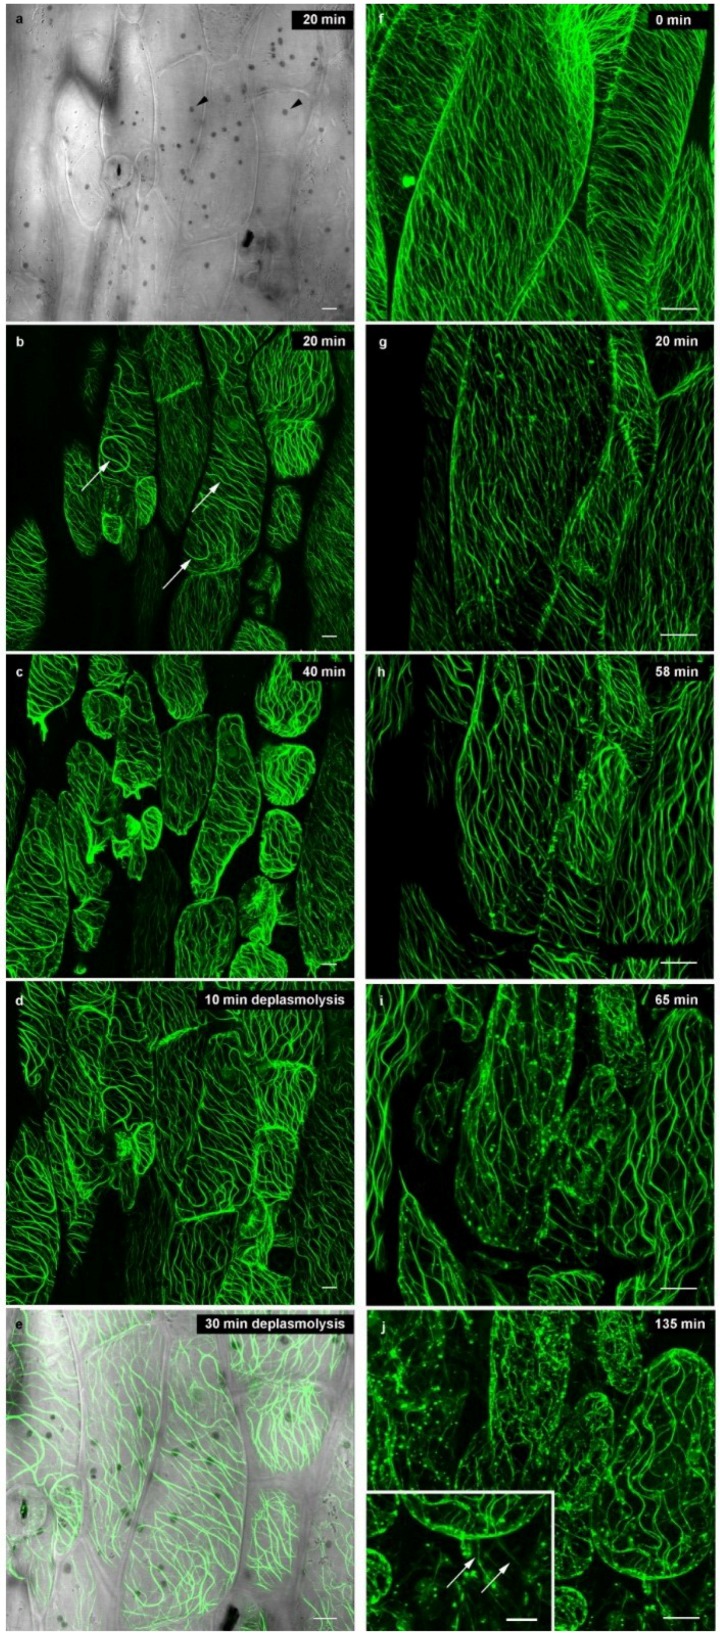
Figure 3.
Cortical microtubules (GFP-MAP4) in Arabidopsis hypocotyl cells during plasmolysis (a–c; f–j) and deplasmolysis (d,e); plasmolysis/deplasmolysis times marked on the micrographs. (a) Bright field image showing cell walls, occasional stomata and chloroplasts (arrowheads); (b) Bundling of microtubules (arrows) at the onset of plasmolysis in 0.8 M mannitol; (c) After 40 min, cortical microtubules are showing waves and bundles; they remain aligned within the cortical cytoplasm; (d) Bundles of microtubules persist in deplasmolysis when the protoplasts become realigned at the cell wall; (e) Overlay of fluorescence and bright field image at the end of the plasmolytic cycle; chloroplasts appear as dark grey dots; (f–j) Higher magnification of plasmolysing hypocotyl cells; inlay in (j) shows microtubules in Hechtian strands (arrows). Bar: 10 µm.

