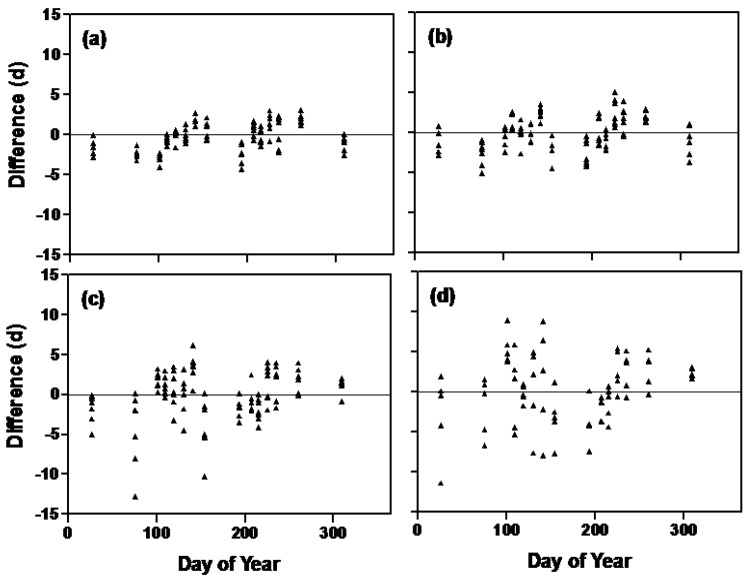
Figure 7.
Differences between multiplicative model predictions and observations for soybean isoline flowering time as they varied with planting day of the year for all 26 isolines. Isolines increase in photosensitivity from (a) to (d). The first seven isolines from Table 1 are grouped in (a) (OT 94-47, OT 89-5, OT 93-26, OT 93-28, OT 94-41, l92-21, l62-667), the next seven in (b) (L71-802, L80-5914, L84-307, L63-2404, Harosoy, L84-307), the next seven in (c) and the last five in (d).

