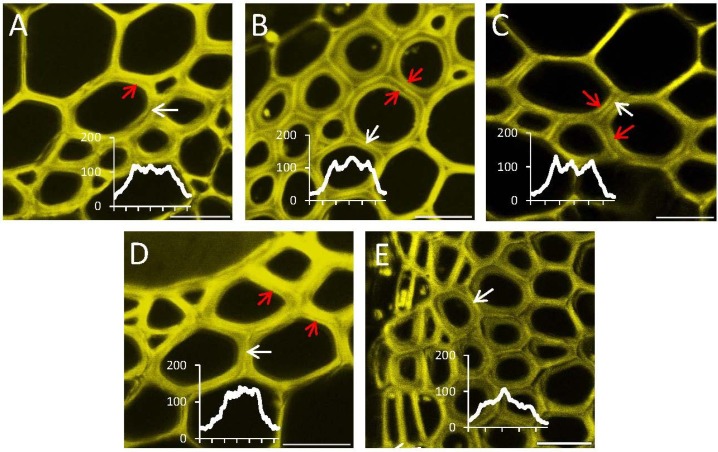
Figure 4.
Distribution of signals from different glycoside hydrolase activities in the cell walls of interfascicular fibers in Arabidopsis stems. (A) Glc-β-Res; (B) Glc-Glc-β-Res; (C) Glc-S-Glc-β-Res; (D) Gal-β-Res; (E) XXXG-β-Res. All reactions were carried out in optimal conditions (Table 1). The yellow fluorescence channel with resorufin signals is shown. Signals from the compound middle lamella are shown with the white arrows, and signals from the recently formed secondary wall layers are shown with red arrows. Intensity profiles through the cell wall area, shown by the white arrows, are included to visualize the labeling patterns in the cell wall better. Bar = 50 μm.

