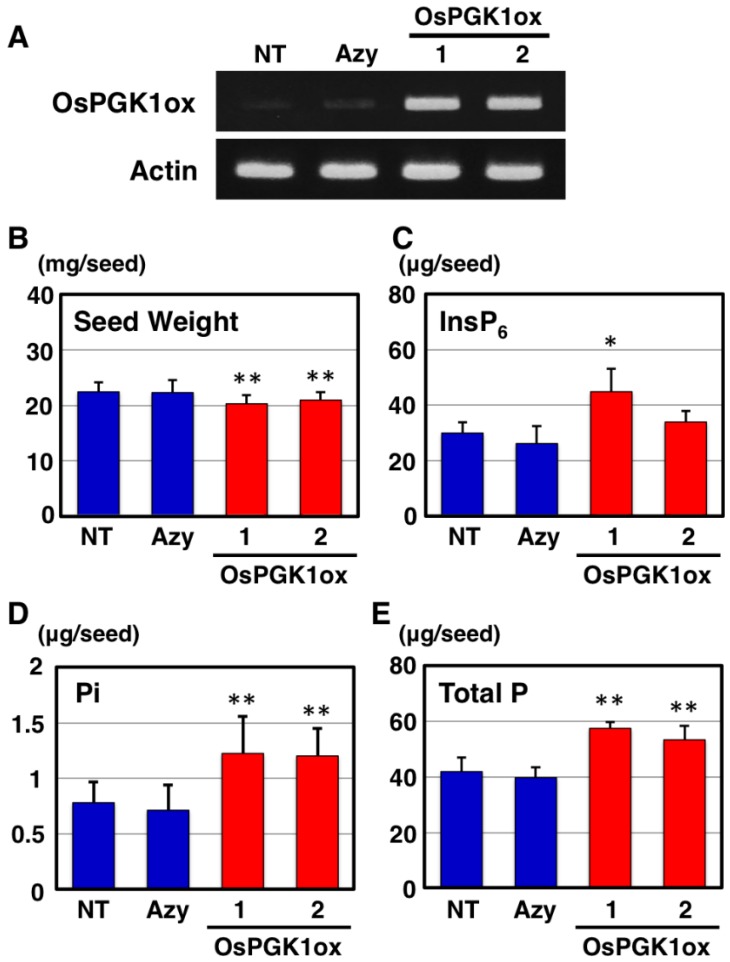
Figure 3.
Gene expression and seed phenotype of OsPGK1ox transgenic plants. (A) Semi-quantitative RT-PCR analysis of the expression of OsPGK1. Total RNA was extracted from flowers of non-transformants (NT), azygous plants (Azy), and two independent OsPGK1ox lines (1 and 2) just before flowering. Actin was used as a reference; (B) Seed weights (n = 20); (C) InsP6 content was determined by ion chromatography (n = 4); (D) Inorganic phosphate content was measured by colorimetric assay using molybdate staining (n = 10); (E) Total P content was measured by ICP-OES analysis (n = 6). Each value (B to E) represents the mean ± SD. * and ** indicate p < 0.05 and p < 0.01, respectively.

