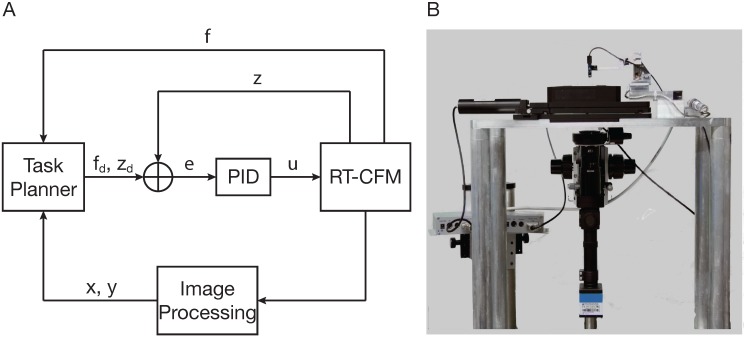
Figure 2.
The real-time cellular force microscope (RT-CFM). (A) Schematic representation of the RT-CFM. f and z are the measured values, and fd, zd are the desired values of force and position, respectively. e is the error between the desired and the measured values of force and position, and u is the control signal that is fed into the RT-CFM positioner. x and y are the coordinates of the measurement location to which the system has to be positioned. The task planner switches the system between measurement, positioning, calibration and post-processing tasks. The proportional-integral-derivative (PID) is the control scheme used to control to the positioner. (B) Custom inverted RT-CFM setup. Block diagram in (A) adapted from [78].

