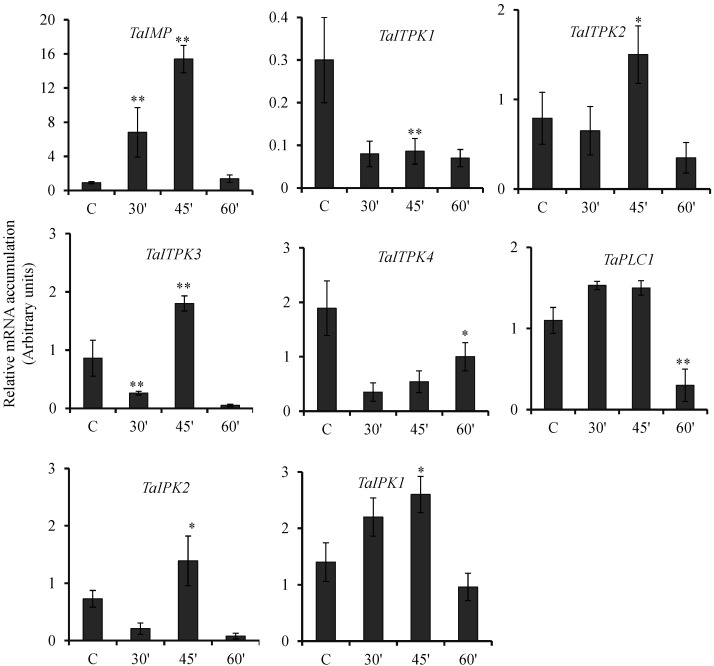
Figure 3.
Effect of GA3 on the expression of PA pathway genes. Relative fold expression of PA pathway genes in wheat grains exposed to GA3 (60 μM) for 30, 45 and 60 min. After the exogenous application, the seeds were collected and RNA extraction was performed. The cDNA templates were prepared from 2 µg of DNase free RNA. Ct values obtained were normalized against Ta18SrRNA expression. Each bar indicates the mean of three to four replicates with the indicated standard deviation of the mean. ** indicates significant difference at p ≤ 0.01; * indicates significant difference at p ≤ 0.05 with respect to control.

