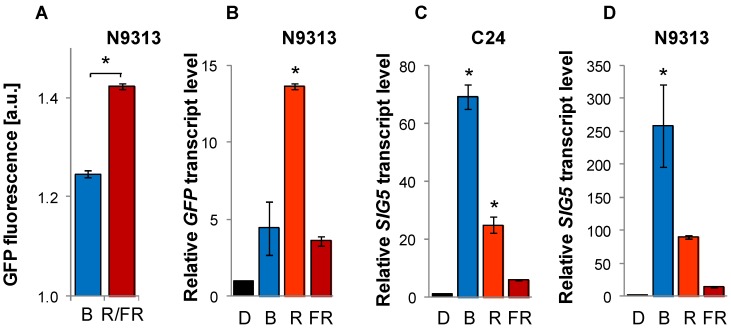
Figure 3.
GFP and SIG5 mRNA levels upon illumination with monochromatic light. (A) GFP fluorescence in 69–92 10 day old N9313 seedlings illuminated with 10 µmol·photons·m−2·s−1 blue light or red/far-red light (R/FR); (B–D) GFP and SIG5 transcript levels in N9313 and C24. Ten day old light grown seedlings were dark adapted for 24 h and then exposed to 100–120 µmol·photons·m−2·s−1 monochromatic blue, red or far-red light for 24 h. Relative transcript levels were determined by qRT-PCR relative to ACT2 transcript level and normalized on the transcript levels of dark adapted seedlings prior to the transfer to monochromatic light. Bars represent means (±SEM). * indicates significant differences from the dark adapted samples (Student’s t-test, p < 0.05).

