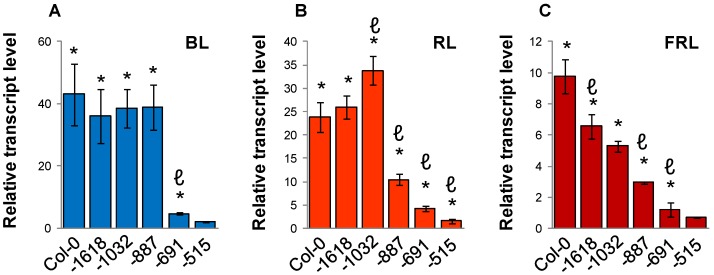
Figure 5.
Mapping of the blue-light (BL; A), red-light (RL; B) and far-red-light (FRL; C) sensitive regions of the Arabidopsis SIG5 promoter by qRT-PCR analysis of SIG5 transcript levels in Col-0 wild-type and SALK T-DNA insertion lines exposed for 24 h to monochromatic light after 10 days growth in darkness. The numbers give the distances of the T-DNA insertions relative to the SIG5 CDS. Values were normalized to the SIG5 transcript level of 24 h dark-adapted seedlings. The data are means of 2–4 biological replicates (±SEM). * indicates significant differences from the dark adapted samples (Student’s t-test, * p < 0.05). ℓ indicates significant differences from the line with the next longer upstream region (Student’s t-test, p < 0.05).

