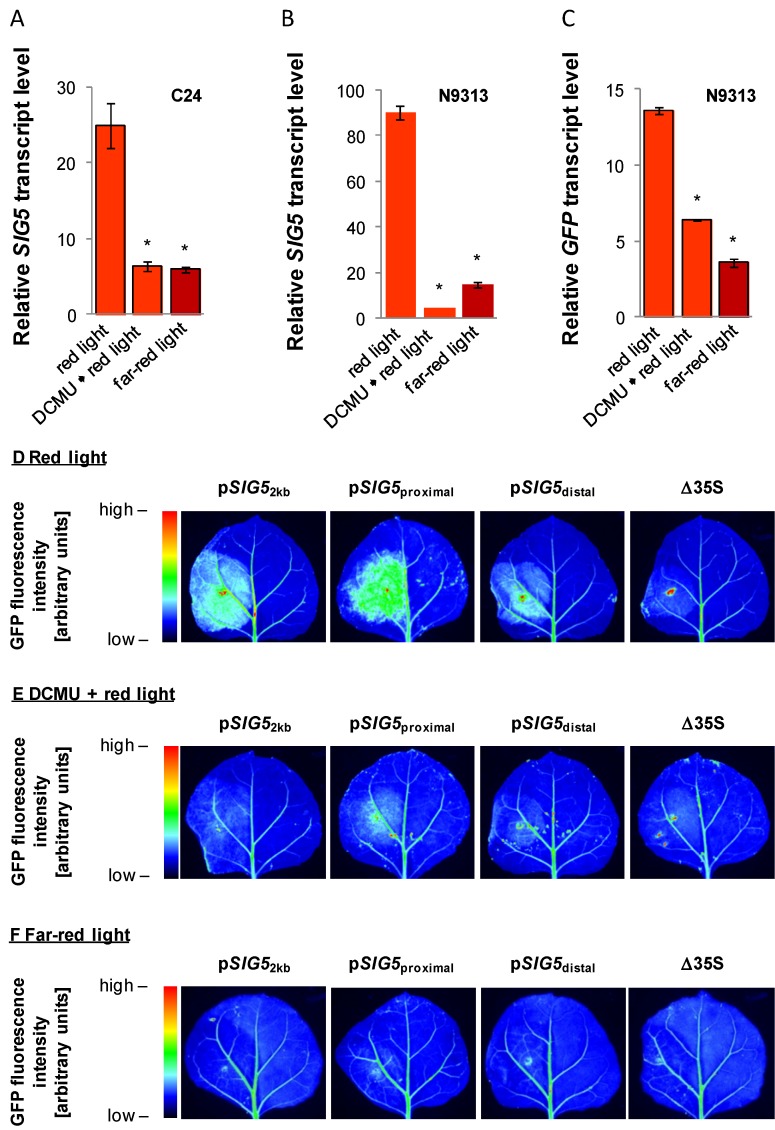
Figure 9.
(A–C) Relative SIG5 and GFP transcript levels in C24 and N9313 in response to red and far-red light and red light 24 h after treatment with 10 µM DCMU and light exposure. The seedlings were pre-cultivated 10 days in 120 µmol photons m−2 s−1 white light followed by 24 h dark incubation. The transcript levels were standardized on ACT2 transcript levels and normalized to the transcript levels prior to the transfer to monocromatic light. Statistical significance of difference (Student T-Test) is indicated as asterisks above bars (p < 0.05); (D–F) GFP expression mediated by the 2 kb full-length SIG5 promoter, the SIG5 proximal and SIG5 distal upstream regions fused to the Δ35S promoter and the Δ35S promoter after 4 days cultivation of the transfected tobacco leaves in monocromatic red and far-red light. In 1/3 of the plants the transfected leaves were sprayed with 1 mM DCMU prior to the exposure to the monochromatic light. The scale of the false color pictures was standardized on the same color scale.

