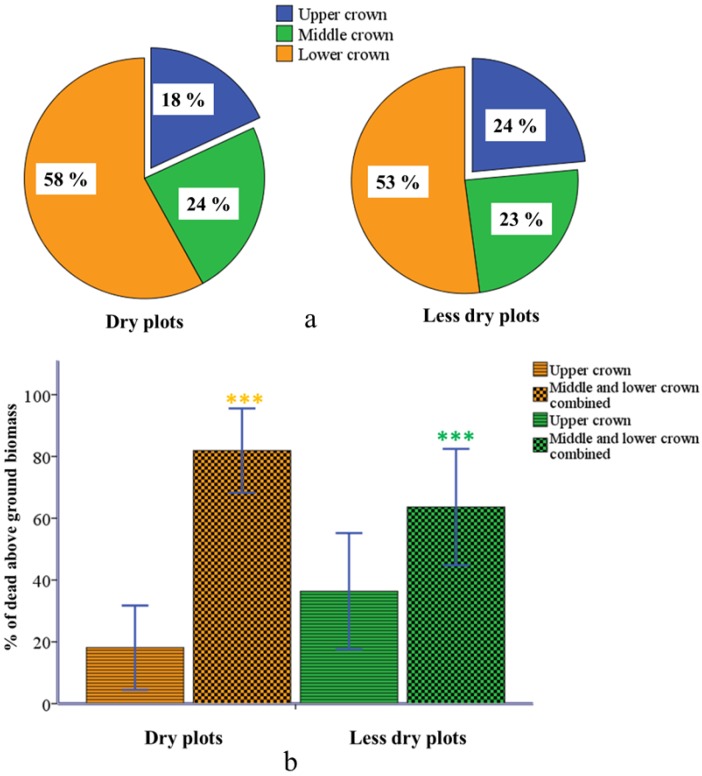
Figure 4.
Magnitude of crown dieback in different vertical crown compartments of the dry and less dry plots. The pie-diagram (a) shows the percentage of crown dieback in plants from dry and less dry plots. The bar diagram (b) compares the percentages of crown dieback between upper crown and the rest of the crown (middle and lower combined) in dry and less dry plots. The thin bars represent the standard error of mean at a 95% confidence interval. Yellow and green asterisks show the significance level (p < 0.001).

