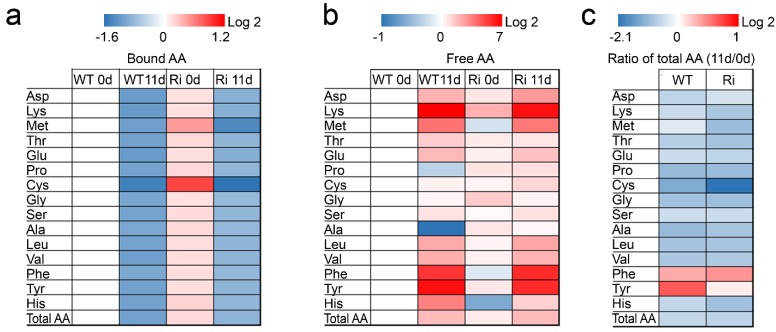
Figure 5.
Heat map of free and protein bound amino acids in wild-type (WT) and SO RNA interference mutant (Ri) plants grown under normal growth conditions (0, day) and after being exposed to eleven days of extended dark stress (11, day). Log2 ratios of bound (a) and free (b) amino acids (AA) fold-changes from WT 0 day are given by shades of red or blue colors according to the scale bar; (c) Log2 ratios of residual to initial total AA were calculated as the Log2 ratio of total AA at 11 day to 0 day and are given by shades of red or blue colors according to scale bar. Asp—aspartate; Lys—lysine; Met—methionine; Thr—threonine; Glu—glutamate; Pro—proline; Cys—cysteine; Gly—glycine; Ser—serine; Ala—alanine; Leu—leucine; Val—valine; Phe—phenylalanine; Tyr—tyrosine; His—histidine. Data represent the mean value of three (WT) and six (Ri) biological replicates for each tissue and time point and statistical analysis performed using Turkey-Kramer HSD test (JMP 8.0 software, [37]; p < 0.05), presented in Supplementary Table S3. The data for SO-compromised plants represent the mean for SO Ri 131 and SO Ri 421 mutants.

