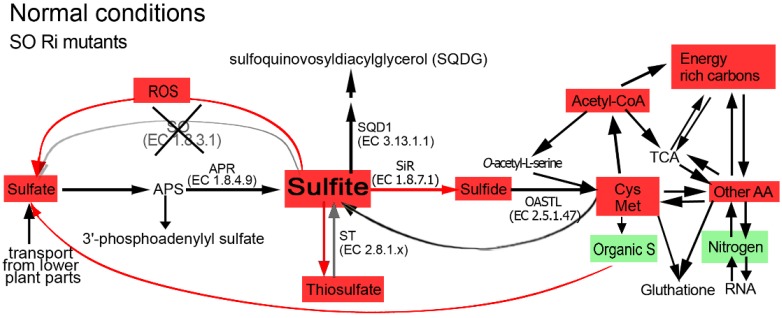
Figure 7.
Schematic illustration describing the impact of sulfite oxidase (SO) impairment on the sulfur, carbon and nitrogen metabolism in tomato plants grown under normal growth conditions. Abbreviations are: adenosine-5′-phosphosulfate (APS), APS reductase (APR), sulfite reductase (SiR) O-acetyl-serine-thiol-lyase (OAS-TL), UDP-sulfoquinovose synthase (SQD1), sulfite oxidase (SO), sulfurtransferases (ST). The Cys Met box indicates the sum of total Cys and Met. The other AA indicates the total detected amino acids other than Cys and Met. Energy rich carbon indicates fatty acids, sucrose, fructose, sorbitol and myoinosytol. TCA indicates pyruvate and the following TCA cycle metabolites: citrate, α-ketoglutarate, succinate, fumarate and malate. Nitrogen indicates the total N as in Table 2. Organic S indicates total organic S as in Supplementary Table S2. ROS indicates the reactive oxygen species as in Supplementary Figure S3. Red and green colored boxes indicate an enhancement or a reduction in metabolite content, respectively, as compared to those in the unstressed top leaves of the wild-type plants. The non-colored metabolites indicate similar levels as compared to the unstressed top leaves of the wild-type plants. The red arrow indicates enhanced SiR activity as compared to wild-type. The grey arrow indicates decreased sulfite oxidation activity due to SO impairment.

