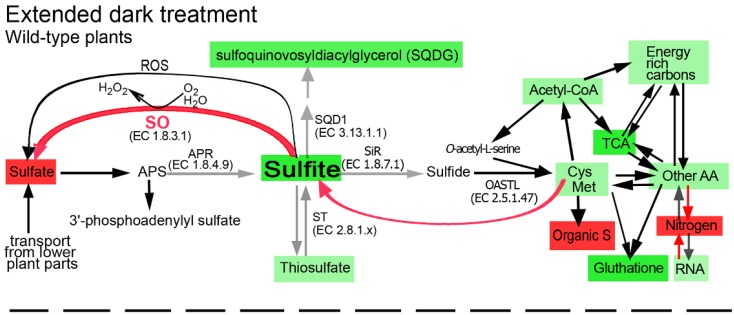
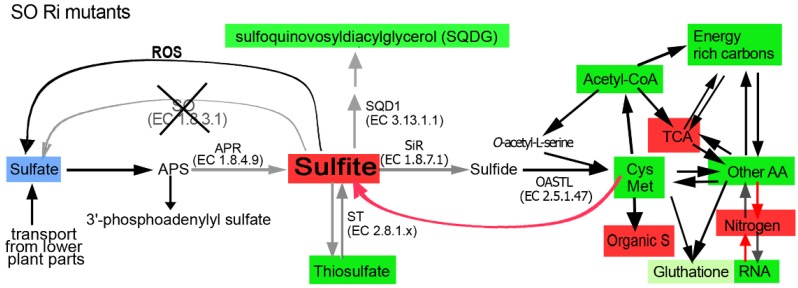
Figure 8.
Schematic illustration describing the impact of sulfite oxidase (SO) impairment on the sulfur, carbon and nitrogen metabolism in the top leaves of tomato plants grown for 11 days in dark. Abbreviations are: adenosine-5′-phosphosulfate (APS), APS reductase (APR), sulfite reductase (SiR) O-acetyl-serine-thiol-lyase (OAS-TL), UDP-sulfoquinovose synthase (SQD1), sulfite oxidase (SO), sulfurtransferases (ST). The Cys Met box indicates the sum of total Cys and Met. The other AA indicates the total detected amino acids other than Cys and Met. Energy rich carbon indicates fatty acids, sucrose, fructose, sorbitol and myoinosytol. TCA indicates pyruvate and the following TCA cycle metabolites: citrate, α-ketoglutarate, succinate, fumarate and malate. Nitrogen indicates the total N as in Table 2. Organic S indicates total organic S as in Supplementary Table S2. ROS indicates the reactive oxygen species as in Supplementary Figure S3. The blue box indicates that the sulfate level was not affected by the stress but was significantly lower in the mutant as compared with the stressed wild-type top leaves [14]. Red or green colors indicate the enhancement or reduction, respectively, in metabolites, as compared to the contents in the unstressed top leaves of the wild-type plants (light green indicates less reduction compared to the darker green). The red arrow from the Cys Met box indicates the direction of sulfite, the degradation product of these amino acids [14]. Red or grey arrows indicate the SO activity enhancement or decrease, respectively. The lack of colored metabolites or colored arrows indicates similar levels as compared to the unstressed top leaves of the wild-type plants.


