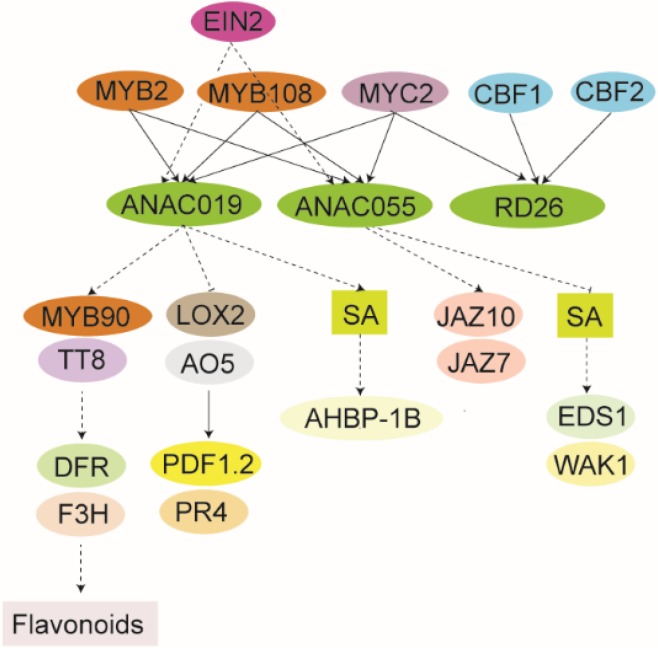
Figure 3.
Schematic showing predicted local GRN of senescence-associated ANAC019, ANAC055, and RD726. All connections are derived from a study based on yeast one-hybrid screenings, time-course gene expression data, and mathematical modeling by Hickman et al. [66], except for the EIN2-ANAC019/ANAC055 and MYC2-ANAC019/ANAC055/RC26 connections which were derived from Kim et al. [108] and Zheng et al. [104], respectively. Thus, all components may not be part of the same functional GRN. The ANAC019, ANAC055, and RD26 have similar expression patterns with induction by ABA and different abiotic stress exposures [43,79,80,89]. Direct binding is shown as black lines, whereas broken lines indicate an effect which may not necessary involve a direct interaction. NAC genes/proteins are shown in green. The rest of the color coding is specific for specific compounds or proteins/genes.

