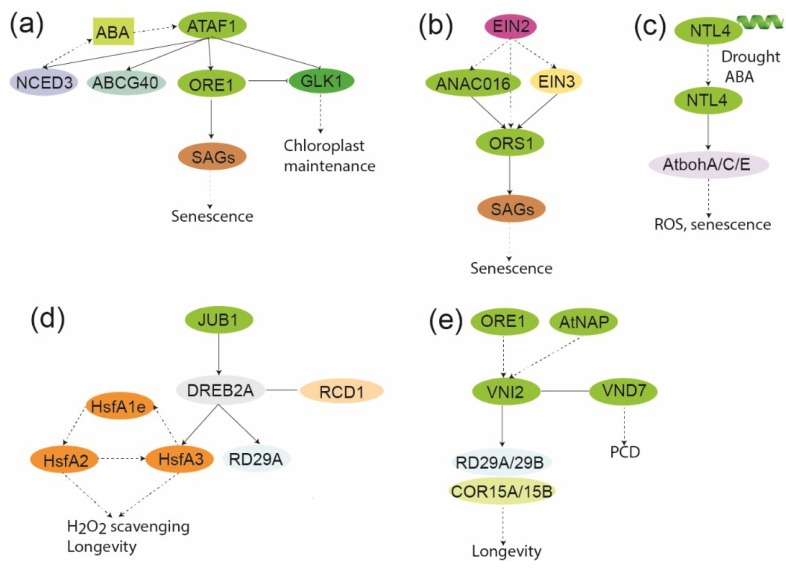
Figure 5.
Schematic showing local GRN of senescence associated NAC genes (a) GRN of ATAF1. The ATAF1-NCED3/ABCG40/ORE1/GLK1 connection is derived from Garapati et al [64]. The interaction between ORE1 and GLK1, inhibiting GLK1 is derived from Rauf et al. [68]. The balance between ORE and GLK1 determines the status of senescence. The connection between ATAF1 and SnRK1.1 was derived from Kleinow et al. [121]. ATAF1 expression is regulated by both ABA and H2O2 through unknown transcription factors [64,80]; (b) GRN of ORS1. The ORS1-SAG connection is derived from Balazadeh et al. 2011 [60], the ANAC016-ORS1 connection is derived from Kim et al. [63], the EIN2-ORS1 connections are derived from Kim et al. [108], and the EIN3-ORS1 connection is derived from Chang et al. [110]. Thus, all components may not be part of the same functional GRN. ORS1 expression is induced by H2O2 through unknown transcription factors (c) GRN of NTL4. Drought and ABA mediate proteolytic processing of NTL4. The NTL4-AtbohA/C/E connections are derived from Lee et al. [90]. NTL4 expression is induced by ABA, drought, and heat. The figure was inspired by a recent review [123]; (d) GRN of JUB1. The JUB1-DREB2A connection is derived from Wu et al. [61], whereas the additional connections are from earlier work [99,124,125,126]. Thus, all components may not be part of the same functional GRN. JUB1 expression is induced by H2O2 through unknown transcription factors. The figure was inspired by a recent review [123]; (e) GRN of VNI2. The VNI2-COR15/COR15B/RD29A/RD29B connection is derived from Yang et al. [62], the VNI2-VND7 interaction is derived from Yamaguchi et al. [127], and the ORE1/AtNAP connection is derived from Kim et al. [108]. Thus, all components may not be part of the same functional GRN. The expression of VNI2 is induced by salt in an ABA-dependent manner. Direct binding is shown by black lines, whereas broken lines indicate an effect which may not necessarily involve a direct interaction. NAC gene/proteins are shown in green. The rest of the color coding is specific for specific compounds or proteins/genes.

