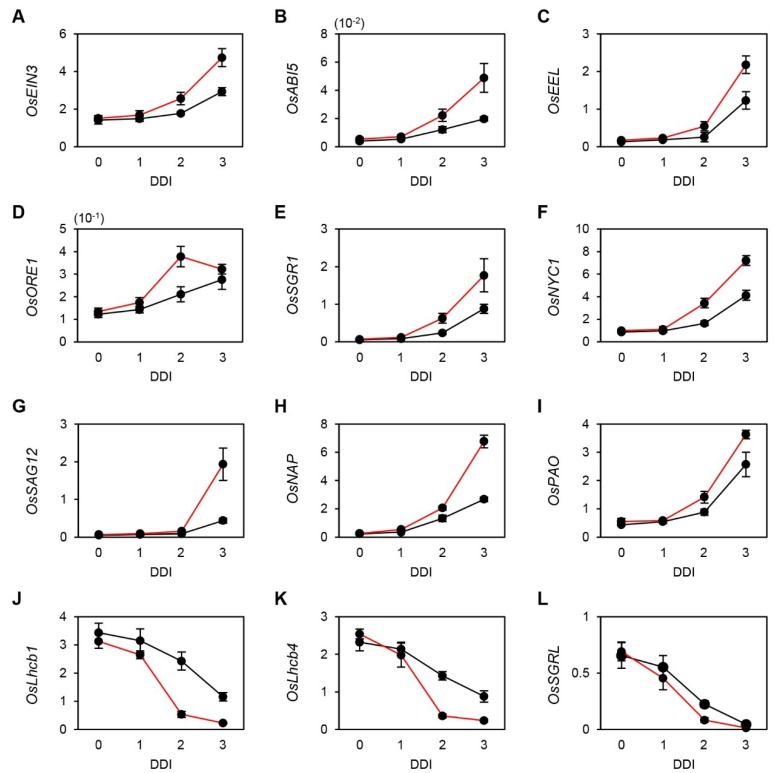
Figure 2.
Expression of senescence-associated genes (SAGs) in WT and osphyB-2 during DIS. Detached leaf segments from one-month-old WT (black line) and osphyB-2 (red line) plants grown under LD conditions were incubated on 3 mM MES (pH 5.8) buffer with the abaxial side up at 28 °C in darkness, and were sampled at 0, 1, 2, and 3 DDI for RT-qPCR. RT-qPCR analysis was used to measure the relative transcript levels of OsEIN3 (A), OsABI5 (B); OsEEL (C); OsORE1 (D); OsSGR1 (E); OsNYC1 (F); OsSAG12 (G); OsNAP (H); OsPAO (I); OsLhcb1 (J); OsLhcb4 (K) and OsSGRL (L) and transcript levels were normalized to the transcript levels of OsUBQ5. Mean and SD values were obtained from more than three biological replicates. These experiments were repeated twice with similar results. DDI, day(s) of dark incubation.

