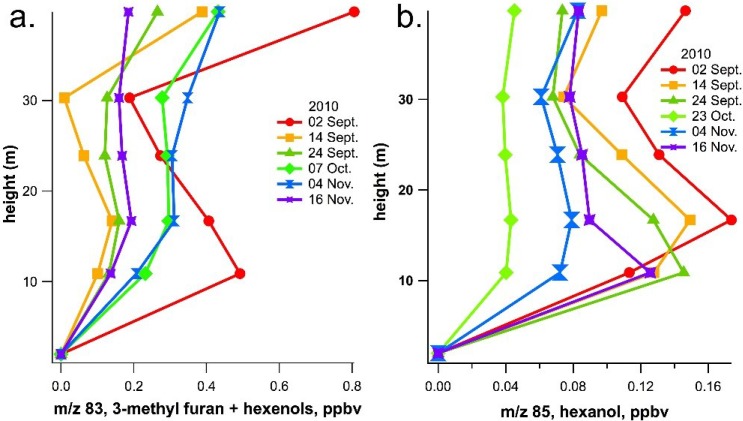
Figure 4.
Mean daytime vertical profiles of GLVs as estimated by PTR-MS on (a) m/z 83 (3-methyl furan + hexenols) and (b) m/z 85 (hexanol) within and above a 30 m rainforest canopy in the central Amazon. Each vertical profile represents the daytime (10 a.m.–4 p.m.) average of continuous observations over a three- to five-day period (starting date shown in legend). Note the buildup of GLVs within the canopy during the dry season as well as a possible contribution of 3-methyl furan from isoprene oxidation above the canopy. The standard deviation at each height was between 20% and 40% of the mean GLV concentration values.

