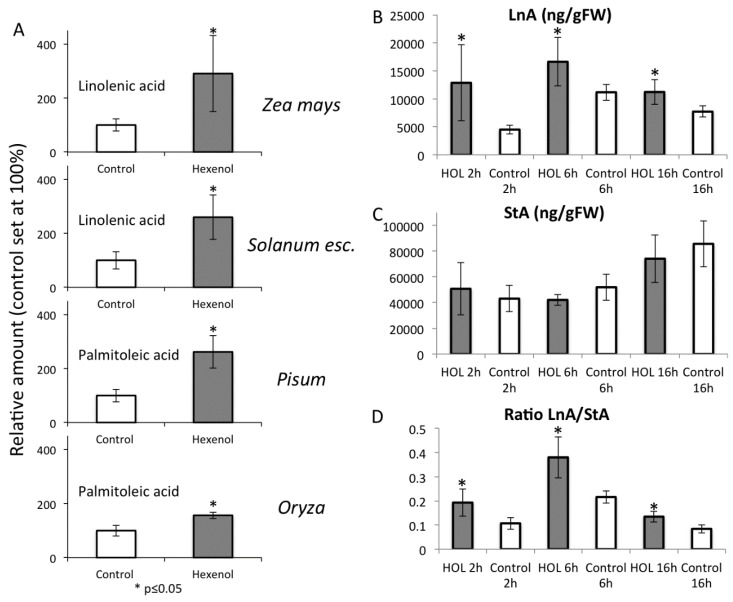
Figure 5.
(A) Increases in free fatty acids in different plant species after exposure to Z-3-hexenol as our model GLV. Plants were exposed to 20 µg of Z-3-hexenol (HOL) for 15 min and free fatty acids analyzed by GC/MS. Note that Zea and Solanum show increased linolenic acid (LnA) levels, whereas in Pisum and Oryza palmitoleic acid was increased. Relative amounts are displayed with free fatty acid levels in control plants set at 100%. * denotes significant differences (t-test, p ≤ 0.05). (B–D) Effects of prolonged GLV treatments on free linolenic acid levels in maize leaves. Maize plants were exposed to 20 μg of GLV for the time indicated. (B) Amounts of free LnA after 2, 6, and 16 h; (C) Amounts of free stearic acid (StA) after 2, 6, and 16 h; (D) Ratios of LnA to StA after 2, 6, and 16 h. * denotes significant differences (t-test, p ≤ 0.05). N = 5, error bars represent standard deviation.

