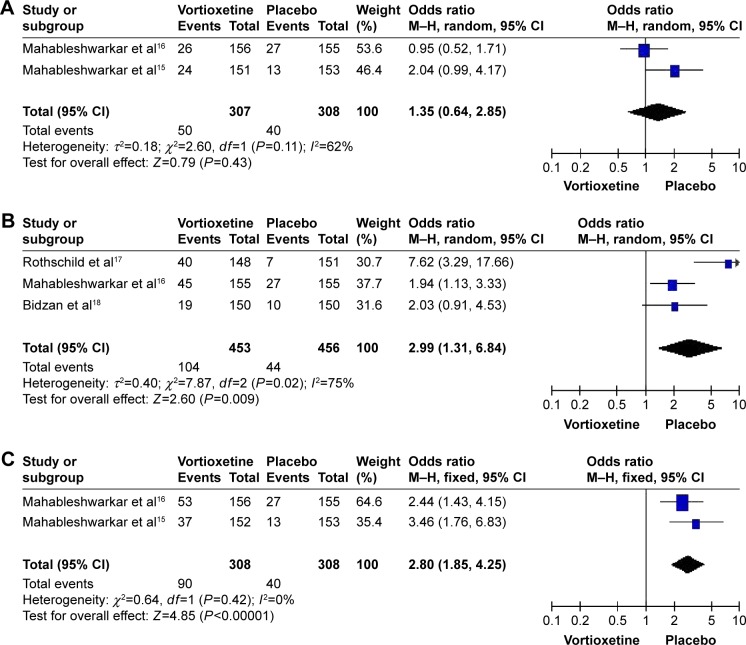
Figure 3.
Odds ratios (ORs) and 95% confidence intervals (CIs) of the individual studies and the pooled data for the included studies comparing the nausea rates between the groups treated with multiple doses of vortioxetine and placebo.
Notes: (A) 2.5 mg/d vortioxetine vs placebo, (B) 5 mg/d vortioxetine vs placebo, and (C) 10 mg/d vortioxetine vs placebo.
Abbreviations: M–h, Mantel–haenszel; df, degrees of freedom.

