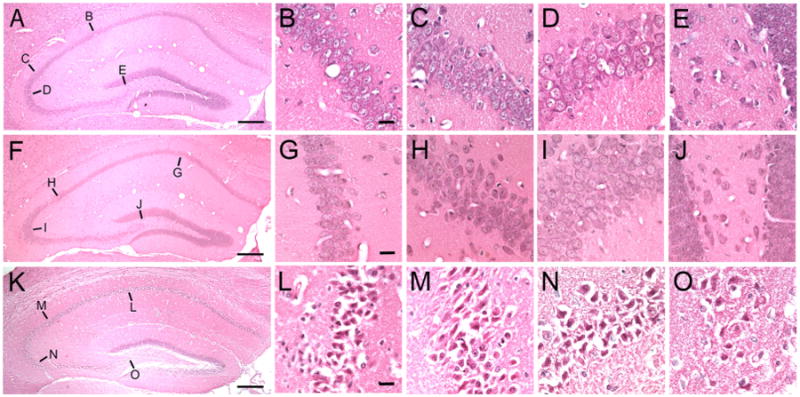
Fig. 2.

Methamphetamine (METH)-treated mice with RESDs have acidophilic neurons in hippocampus. (A), (F) and (K) are low magnification photomicrographs of the right dorsal hippocampus in control (A), METH-treated mice without RESDs (F) and METH-treated mice with RESDs (K). In (A), (B) through (E) are the CA1, CA2, CA3 and dentate hilar regions from which the high magnification photomicrographs (B–E) were taken (the lines point to the approximate areas in (A), (F) and (K)). In (F), (G) through (J) and in (K), (L) through (O) point to the CA1-CA3 and hilar regions from which the high magnification photomicrographs were taken. (A), (F) and (K) were taken from the same mice whose EEGs are shown in Fig. 1. The shrunken acidophilic neurons can be clearly distinguished from the normal neurons in the control mouse and the mouse given METH without RESDs. The scale bars in (A), (F) and (K)=400 μm and the scale bars in (B), (G) and (L) = 10 μm.
