
Figure 10.
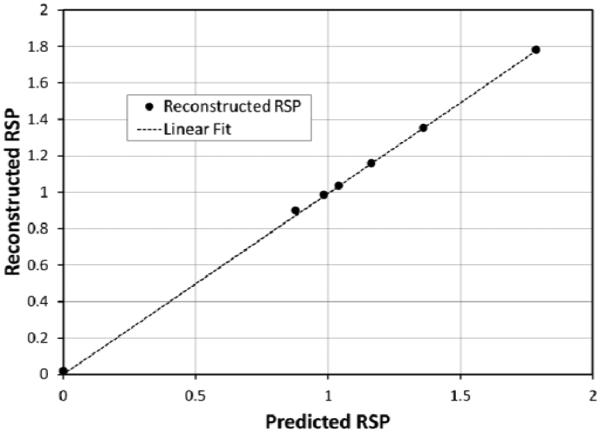
The measured RSP of inserts in the CATPHAN 404 phantom, compared with the predicted values. The dashed line is a linear fit constrained to pass through the origin. It has a slope of 0.994 ± 0.009. Vertical statistical error bars on the data points are too small to be visible.