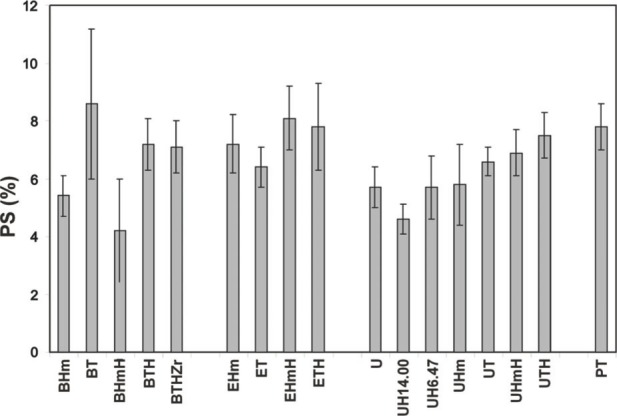
Fig. 11.

Mean values and standard deviations (indicated by bars) of the polymerization shrinkage of Bis-GMA-, EBPADMA- or UDMA-based ACP-filled composites (filler loading: 40 % mass fraction; average for u-ACP, Si-ACP and Zr-ACP) compared to TP composites. Number of runs in each experimental group n ≥ 9. The standard deviation is taken as a measure of the standard uncertainty.
