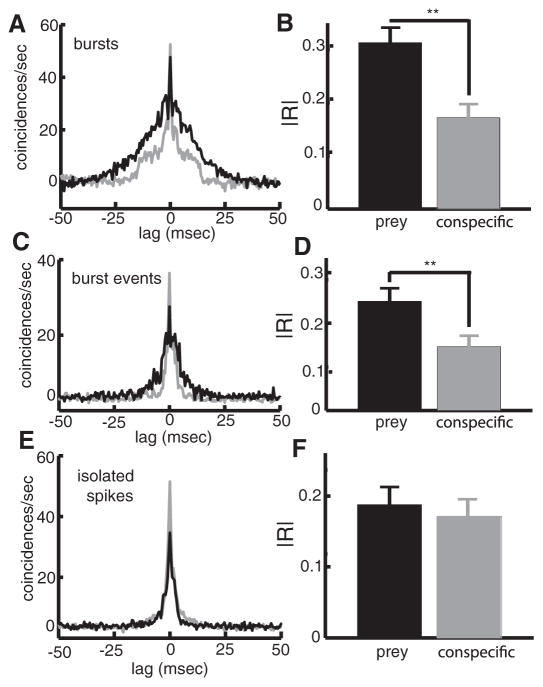
FIG. 5.
Changes in burst dynamics underlie the changes in correlated activity seen under prey-like and conspecific-like stimulation. A: population-averaged CCGs obtained from burst spikes under prey-like and conspecific-like (stimulation; note that the CCGs from EI pairs were inverted when computing the population average). B: population-averaged absolute cross-correlation coefficient |R| for burst spikes under prey-like and conspecific-like stimulation were significantly different. C: population-averaged CCGs obtained from burst events (i.e., only the 1st spike of a burst) under prey-like and conspecific-like (stimulation; note that the CCGs from EI pairs were inverted when computing the population average). D: population-averaged absolute cross-correlation coefficient |R| for burst events under prey-like and conspecific-like stimulation were significantly different. E: population averaged CCGs obtained from isolated spikes under prey-like (blue) and conspecific-like (stimulation). F: population-averaged absolute cross-correlation co-efficient |R| for isolated spikes under prey-like and conspecific-like stimulation were not significantly different. **, statistical significance using a paiwise t-test at the P = 0.01 level with n = 38.

