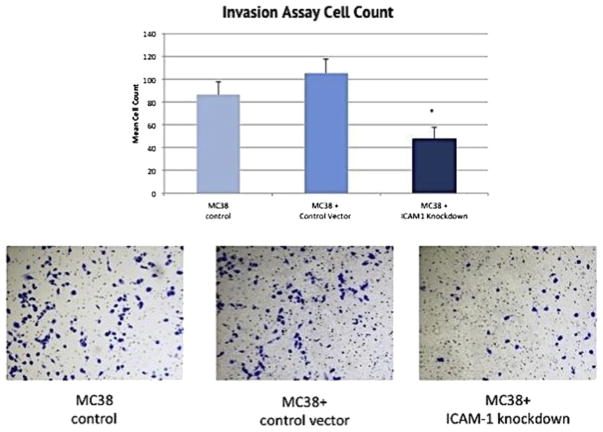
Fig. 5.
Analysis of rate of MC38 cell invasion through the membrane of the invasion chamber. *P <0.03 compared with the control group. Images following the graph show microscopic images of MC38 cells within the matrix of the chamber membrane and stained with crystal violet. The x-axis of the graph separates the three cell groups and the y-axis measures the mean count of invaded cells. (Color version of figure is available online.)

