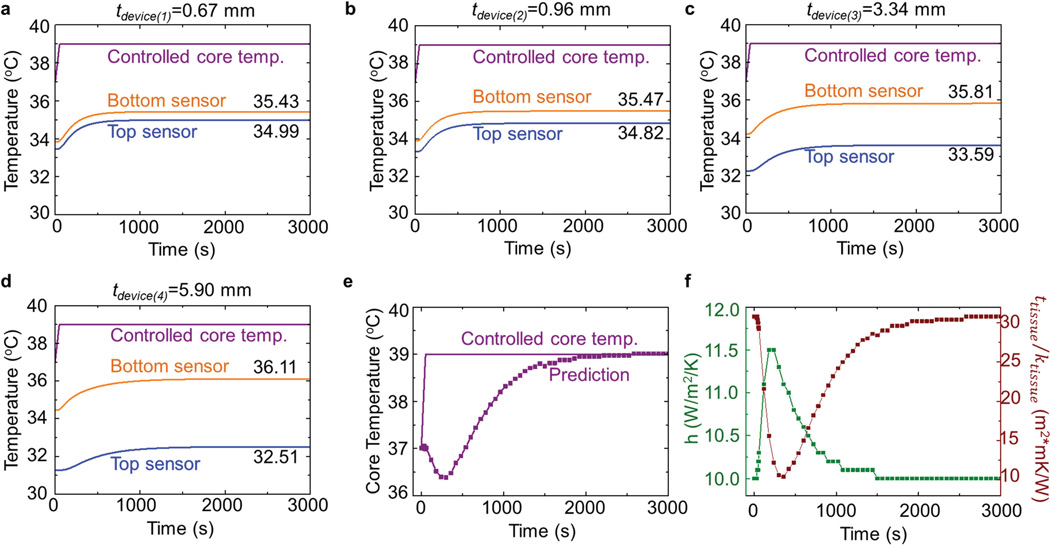
Figure 3.
Transient effects in the thermal conduction model. a–d) Temperature history of top and bottom sensors due to an increase in the core body temperature from 37 °C to 39 °C over 50 s, for four devices with tdevice = 0.67, 0.96, 3.34, and 5.90 mm. e) Predicted evolution of core body temperature by using the sensor temperatures in (a–d) as inputs. f) Predicted evolution of the convection coefficient and tissue property by using the sensor temperatures in (a–d) as inputs.

