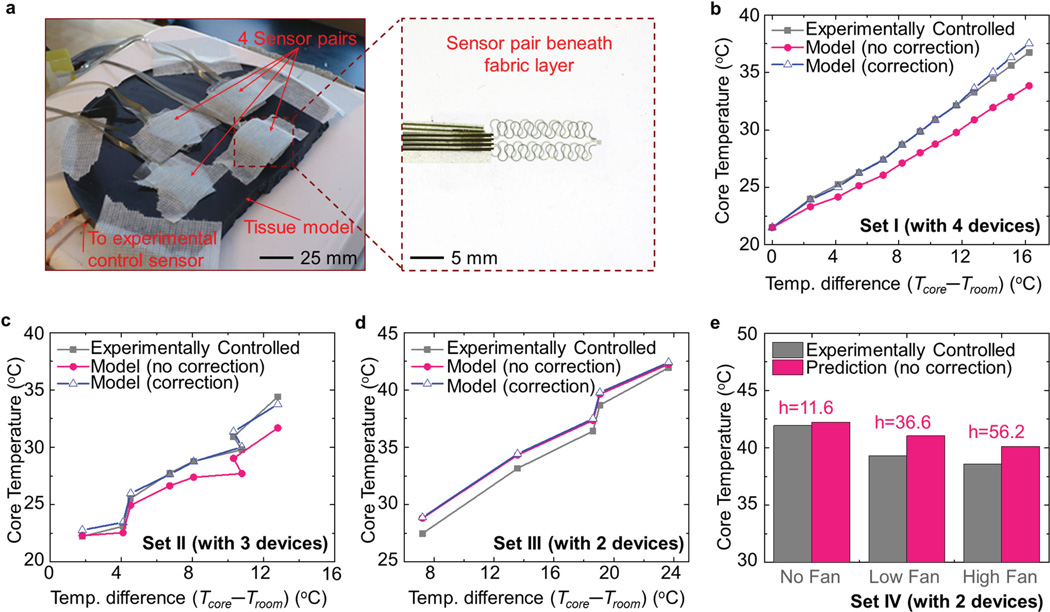
Figure 5.
Experiments for validation of the theoretical model. a) Photograph of the experimental setup. Experimentally controlled core body temperature and the model predictions based on the developed algorithm in the (b) first set of experiments with four devices (5.9, 3.34, 0.96, and 0.67 mm) with a lateral size of 20 mm × 20 mm, c) second set of experiments with three devices (5.9, 3.34, and 0.96 mm) with a lateral size of 20 mm × 20 mm, and d) third set of experiments with two devices (4.02 and 2.24 mm) with a lateral size of 50 mm × 50 mm. e) Histogram of model predictions for core body temperature under three different levels of convection conditions using two devices (4.02 and 2.24 mm) with a lateral size of 50 mm × 50 mm.

