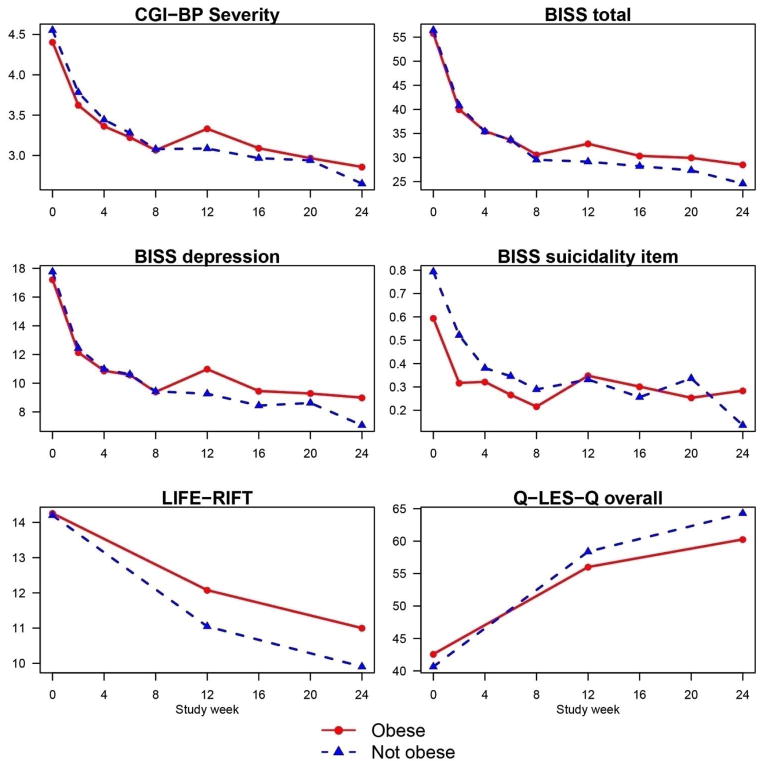
Figure 1.
Means of selected clinical outcomes by study week and baseline obesity status
Based on mixed effects regression models, all differences in slopes between obese and non-obese patients were significantly different from zero (all P’s < 0.05 for outcomes in figures above)
Key: BISS = Bipolar Inventory of Symptoms Scale; CGI-BP Severity = Clinical Global Impression Severity Scale for Bipolar Disorder; CI = confidence interval; LIFE-RIFT = Life-Range of Impaired Functioning Tool; Q-LES-Q = Quality-of-Life Enjoyment and Satisfaction Questionnaire

