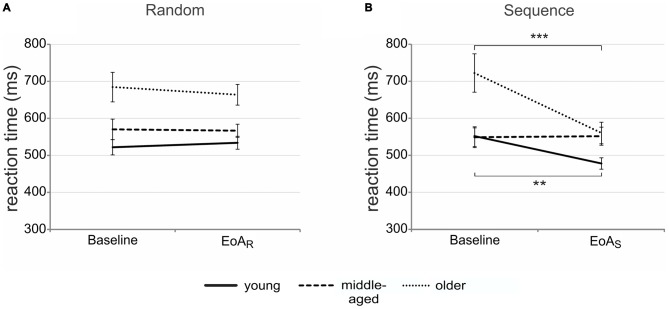
Figure 2.
Motor sequence learning. Mean reaction times (RTs) for randomly (A) and sequentially (B) presented bars at baseline and end of acquisition in the three age groups. Error bars indicate standard error of the mean (SEM); **p < 0.01; ***p < 0.001; end of acquisition random (EoAR); end of acquisition sequence (EoAS).

