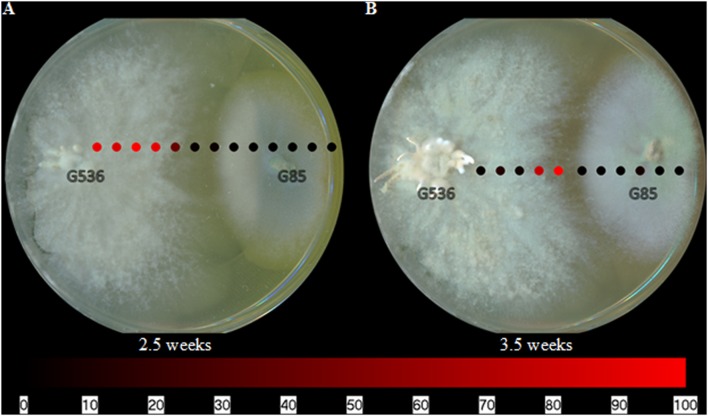
FIGURE 5.
The spatial distribution of griseofulvin from X. cubensis (G536) while grown in co-culture with P. restrictum (G85) at (A) 2.5 weeks and (B) 3.5 weeks. Each circle represents a sampled location. Griseofulvin was most intense where the circles are bright red. The bottom bar indicates the relative amount of signal as measured via mass spectrometry.

