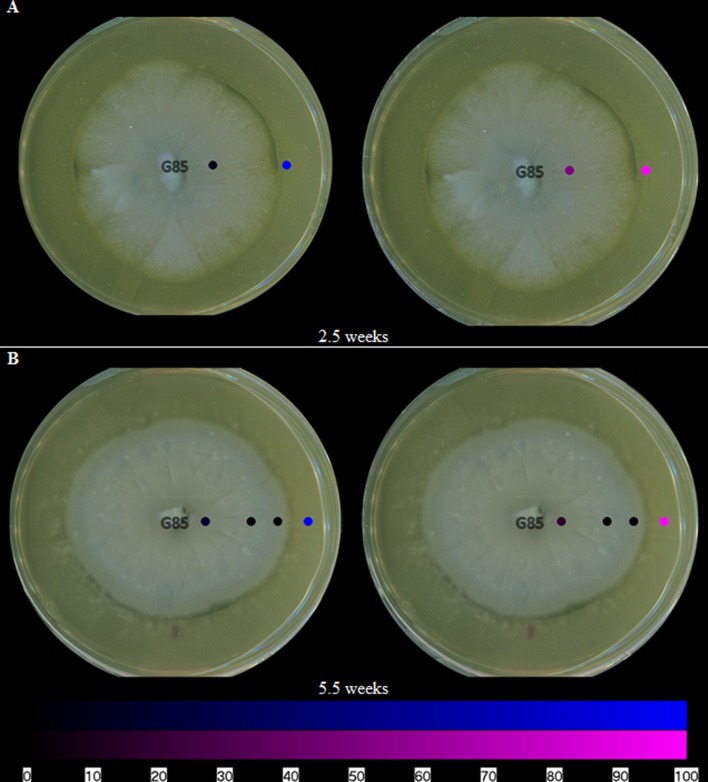
FIGURE 6.
The spatial distribution of both groups of polyhydroxyanthraquinones on fungal isolates of P. restrictum (G85) at (A) 2.5 weeks and (B) 5.5 weeks. The color coding (blue and purple) corresponds to the structures in Figure 1. Each circle represents a sampled location. The polyhydroxyanthraquinones were most intense where the blue or purple circles were brightest. The bottom bar indicates the relative amount of signal as measured via mass spectrometry.

