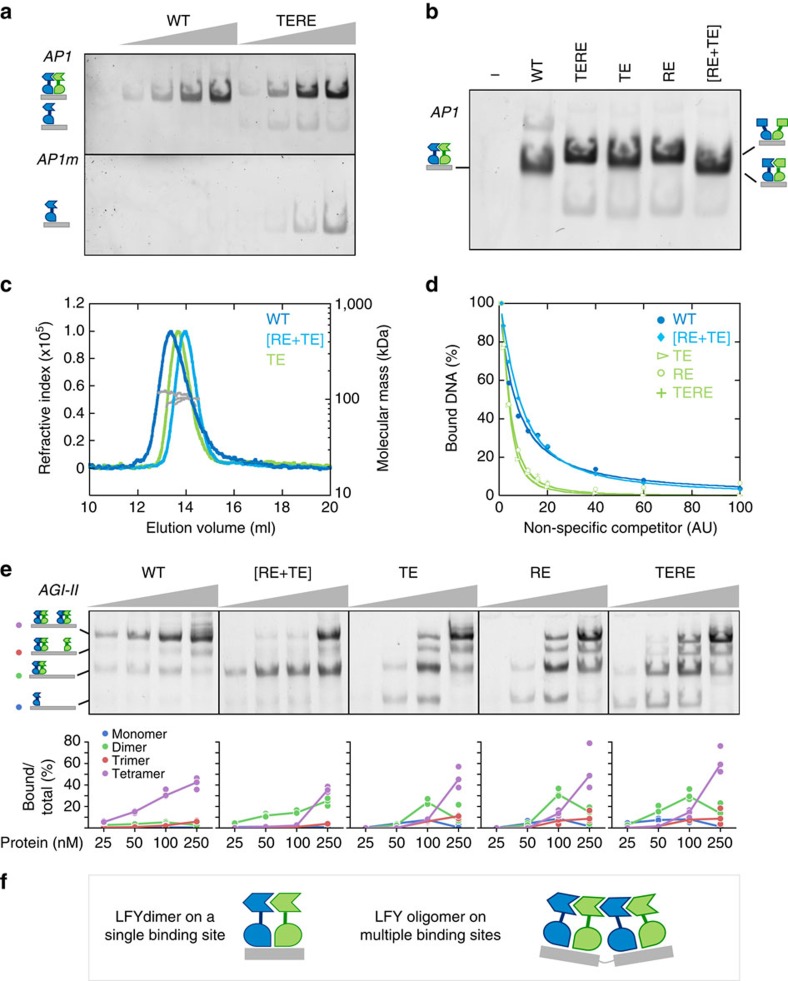
Figure 4. Role of the LFY-SAM oligomerization domain in in vitro DNA binding.
(a) EMSA with 10 nM AP1 or AP1m DNA probe and 0, 50, 100, 250 and 500 nM GbLFYΔ (WT) or GbLFYΔTERE (TERE) protein. This experiment was performed four times with similar results. (b) EMSA with 10 nM AP1 DNA and 500 nM GbLFYΔ (WT), GbLFYΔ[RE+TE] [RE+TE], GbLFYΔTE (TE), GbLFYΔRE (RE) or GbLFYΔTERE (TERE) protein. This experiment was performed twice with similar results. (c) SEC-MALLS molecular mass analysis of GbLFYΔ, GbLFYΔTE and GbLFYΔ[RE+TE] in complex with the AP1 probe. Fifty microlitres containing 2.6 mg ml−1 (60 μM) protein and 15 μM DNA were used. Elution profiles were monitored by excess refractive index (left ordinate axis). The line under each elution peak shows the molecular mass distribution (right ordinate axis). The measured molecular mass for each complex is reported in Supplementary Table 1 and is consistent with that of a protein dimer on DNA. The SEC experiment was performed twice and the MALLS measurement was performed once. (d) Percentage of DNA bound to LFY as a function of nonspecific unlabelled competitor DNA concentration. Quantifications were based on EMSA shown in Supplementary Fig. 4c. This experiment was performed four times with similar results. (e) EMSA with 10 nM AGI-II DNA probe and 25, 50, 100 and 250 nM GbLFYΔ, GbLFYΔ[RE+TE], GbLFYΔTE, GbLFYΔRE or GbLFYΔTERE protein. Quantifications show the percentage of total DNA bound by one (monomeric complex, blue), two (dimeric complex, green), three (trimeric complex, red) or four (tetrameric complex, violet) LFY proteins. EMSA have been performed in triplicate and the fit follows the median value. Formation of the tetrameric complex starts at lower concentrations for WT GbLFY as compared with the mutant GbLFY versions. (f) Schematic representation of LFY bound as dimer on a single binding site (left) and as tetramer on two binding sites (right) deduced from the EMSA and SEC-MALLS analysis. DNA is in grey and LFY in blue and green. For all EMSAs, only the protein–DNA complexes are shown.

