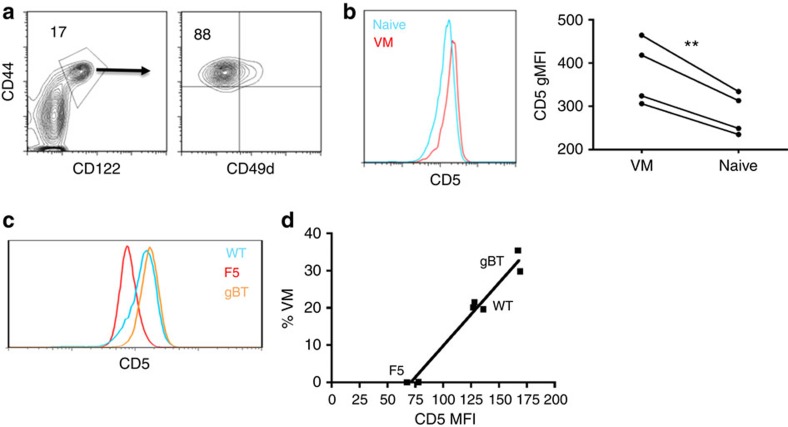
Figure 1. VM cells resemble cells that have undergone HP in both integrin expression and affinity.
(a) Flow cytometry on splenocytes isolated from unmanipulated WT mice. Gating on CD44hi/CD122hi CD8 T cells (left, percentage of CD8 above gate). Gated population visualized by CD44/CD49d (right, percentage of VM cells [CD44hi, CD49dlo] above population). (b) Naive (CD44lo) and VM (CD44hi, CD49dlo) CD8 T cells from the same mouse stained for CD5. Representative histogram overlay of the two populations (left), gMFI comparison (right; **P<0.01, paired t-test, representative of two experiments of n=4 per group and n=3 per group). (c,d) Naive (CD44lo) CD8 T-cell populations from polyclonal and WT mice were stained for CD5. (c) Representative flow histogram overlay of naive CD5 distributions for WT (blue), F5xRag−/− (red) and gBTxRag−/− (orange) (one mouse per histogram; representative of three experiments). (d) gMFI of naive populations graphed against per cent VM cells found in each mouse (linear regression, r2: 0.97, P<0.0001; representative of two experiments with at least n=2 per group).

