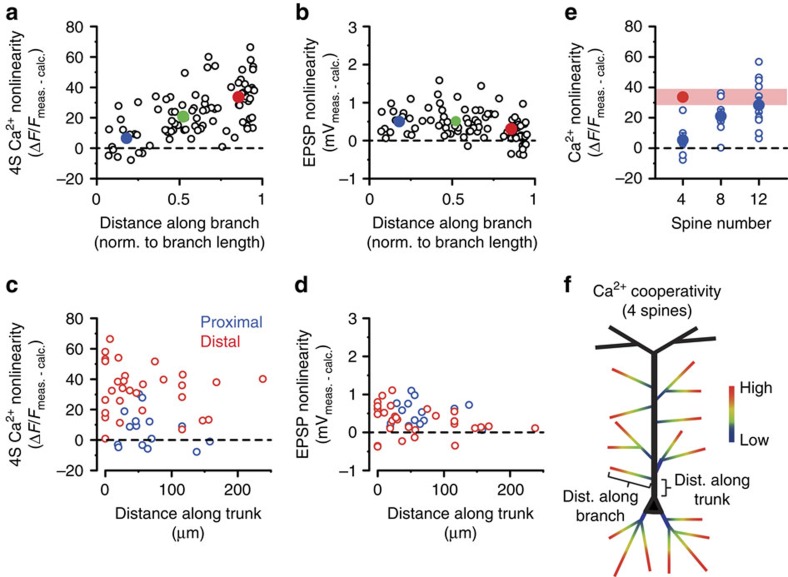
Figure 2. Dendritic map of synaptic cooperativity.
(a,b) Cooperative spine Ca2+ nonlinearity (a, as described in Fig. 1g) and somatic EPSP nonlinearity (b, difference between measured and calculated peak amplitudes) evoked by four coactivated spines at different relative locations along individual branches. Open circles represent individual spine sets (results of all four spines averaged, 1 set/branch; middle branch data points are from experiments in Fig. 6). Filled symbols and error bars represent mean±s.e.m. for proximal (relative location (RL)<0.33, blue, n=16 experiments in 11 cells), middle (RL=0.33–0.67, green, n=33 experiments in 20 cells) and distal (RL>0.67, red, n=37 experiments in 25 cells) locations. Correlations: spine Ca2+ nonlinearity (a): Spearman R=0.606, P<0.001; somatic EPSP nonlinearity (b): Spearman R=−0.379, P<0.001. (c,d) Cooperative spine Ca2+ nonlinearity (c) and somatic EPSP nonlinearity (d), evoked by four coactivated spines located proximally (blue) or distally (red) within apical oblique dendrites, as a function of the distance of the originating branch point from the soma. Spearman rank correlations; (c) proximal: R=−0.193, P=0.490, n=15; distal: R=−0.097, P=0.608, n=30; (d) proximal: R=0.044, P=0.874; distal: R=−0.370, P=0.044. (e) Spine Ca2+ nonlinearity using increasing number of inputs in proximal dendritic segments (blue, n=6/7/11 for clusters of 4, 8 and 12 spines, respectively). Red symbol and band represent mean and 95% confidence interval, respectively, of the data obtained in distal segments with four spines. Comparison of 12S proximal and 4S distal data: Mann–Whitney test, P=0.404. (f) Schematics of the dendritic cooperativity map and distance measurements. dist., distance; calc., calculated; meas., measured; norm., normalized.

