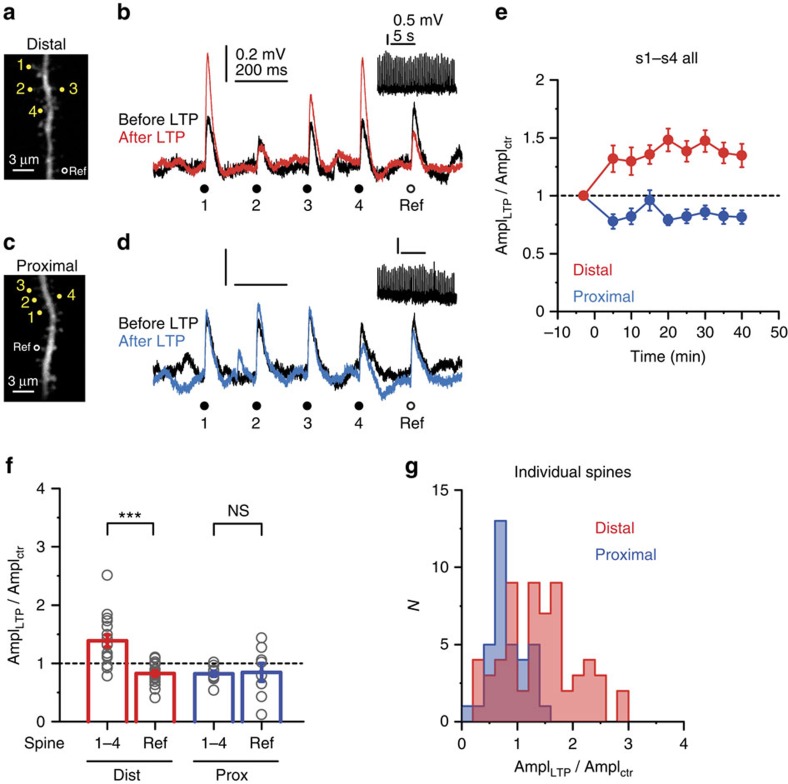
Figure 7. Cooperative synaptic LTP in distal but not in proximal dendritic segments.
(a) 2P image of a distal segment in an oblique branch. Spines s1–s4 were included in the LTP protocol; the reference spine did not receive LTP induction stimulus. (b) Somatic EPSPs by the five spines (s1–s4 (yellow circles) and reference spine (black circle)) in a, before (black) and >30 min after (red) delivering the LTP induction protocol to s1–s4 (inset shows LTP induction voltage trace). (c,d) Similar experiment as in a and b on a proximal segment in an oblique branch. (e) Time course of the effect of cooperative LTP protocol on somatic EPSP amplitude at s1–s4 in distal and proximal dendritic segments. (f) Summarized effect of the cooperative LTP protocol on peak somatic EPSP amplitude evoked in distal versus proximal segments in s1–s4 (distal (red), n=17 cells; proximal (blue), n=10 cells, grey circles represent averaged data from s1–s4 in individual experiments.) and in reference spines (distal (red), n=16; proximal (blue), n=8, grey circles represent individual spines). (g) Histogram of EPSP amplitude change in distal (red) and proximal (blue) s1–s4 spines. Note the normal distribution of the LTP effect in distal spines (Shapiro–Wilks test, P=0.120). Group data are presented as mean±s.e.m. ctr, control; Dist, distal; Prox, proximal; Ref, reference.

