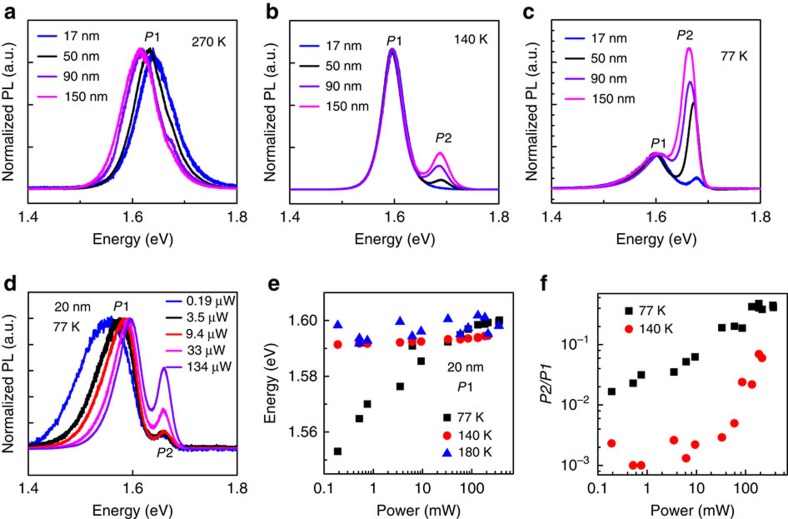
Figure 4. Thickness and excitation power-dependent photoluminescence studies.
(a–c) The photoluminescence spectra for four different thickness halide perovskite microplates at 270 K (a), 140 K (b) and 77 K (c). A 488-nm laser with a power of 3.5 μW was used as the excitation source. All spectra are normalized by the low-energy peak P1 in order to easily compare among each other. (d) The excitation power-dependent PL spectra for a 20-nm-thick microplate at 77 K. The spectra have been normalized by the low-energy emission peak P1. (e) The excitation power-dependent emission peak position of the tetragonal phase for the 20-nm perovskite microplate. (f) The P2/P1 ratios extracted from their corresponding PL spectra under different excitation power at 77 K (black squares) and 140 K (red dots).

