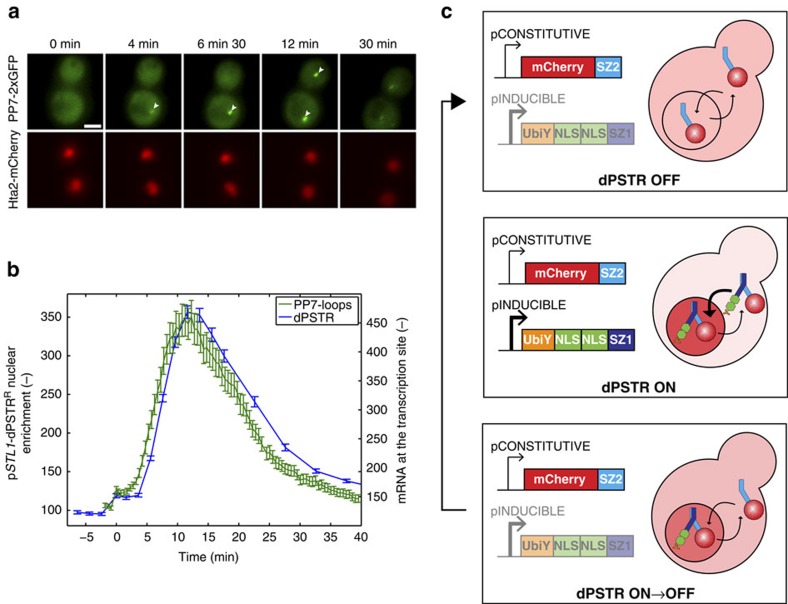
Figure 2. Measurements of transient gene expression.
(a) Maximum intensity projections from Z-stacks of cells bearing an Hta2-mCherry tag and transformed with the PP7-2xGFP system with 24 mRNA PP7-stem loops under the control of the STL1 promoter stimulated with 0.2 M NaCl. The presence of transcription site in the nucleus is highlighted by white arrowheads. Scale bar represents 5 μm. (b) Comparison between the mRNA apparition at the transcription site using the PP7-2xGFP (green, NC=285) and the unstable pSTL1-dPSTRR nuclear enrichment (blue, NC=655) in two different strains, under stimulation by 0.2 M NaCl. The fluorescence of the transcription site was quantified by measuring the difference between the 20 brightest pixels in the nucleus and the average nuclear fluorescence. (c) The dPSTR was modified to measure transient gene expression by addition of an UbiY destabilization sequence at the N-terminus of the induced peptide (2xNLS-SZ). The degradation of the induced construct allows the FP to recover its initial homogenous distribution throughout the cell after stimulation.

